


Trusted by over 15 Million Traders
The Most Awarded Broker
for a Reason
Easy Access to 1,400+ Global Assets
EURUSD
Euro vs U.S. Dollar
US500
S&P 500 (US500)
GOLD
Gold
COFFEE
US Coffee
Apple
Apple (AAPL.OQ)
-

Finance Magnates 颁发
-

Finance Magnates 颁发
-

Capital Finance International Magazine (CFI.co) 2024年颁赠
-

COLWMA 2024年颁赠
-

荣获World Finance Forex Awards 2023最佳外汇客户服务奖
-

荣获World Finance Forex Awards 2023欧洲最佳外汇经纪商奖
-

荣获World Finance Forex Awards 2023澳大拉西亚最佳外汇经纪商奖
-

荣获World Finance Forex Awards 2023拉丁美洲最佳外汇经纪商奖
-

荣获World Finance Forex Awards 2023中东最佳外汇经纪商奖
-

CFI.co于2023年颁赠
-

荣获2023年City of London Wealth Management Awards
-

荣获2022年埃及金融博览会颁赠
-

荣获2022年City of London Wealth Management Awards
-

CFI.co于2022年颁赠
-

荣获Global Forex Awards 2022 — 零售外汇 颁赠
-
2021年迪拜外汇博览会获颁赠
-

Ultimate Fintech 2021年颁赠
-

荣获2021年City of London Wealth Management Awards
-

FX168于2020年12月颁赠
-

荣获Global Business Awards 2020
-

荣获2020年City of London Wealth Management Awards
-

Capital Finance International Magazine (CFI.co)颁赠
-

Capital Finance International Magazine (CFI.co)颁赠
-

荣获2019年City of London Wealth Management Awards
-

Shares Magazine 授予 UK Forex Awards 2018
-

Capital Finance International Magazine (CFI.co)颁赠
-

Capital Finance International Magazine (CFI.co)颁赠
-

2017年伦敦财富管理奖
-

2016最佳本土 客户服务
-

中东和北非地区(MENA)增长最快的经纪商
-
2015年最佳外汇科技提供商
-
2014年最佳外汇科技提供商
-

2014年最佳外汇科技提供商
-

荣获 The Trading Show 2024年非洲 Africa Fintech 峰会颁赠
-

荣获2024年中东地区 Brokersview 颁赠
-
荣获2024年中东地区 Brokersview 颁赠
-

荣获2024年阿曼 Smart Vision 峰会颁赠
-

荣获2024年迪拜外汇博览会颁赠
-

荣获2024年迪拜 Forex Traders Summit 颁赠
-

2024年埃及 Smart Vision 峰会颁赠
-

投查查于2024年颁赠
-

Capital Finance International Magazine (CFI.co) 2024年颁赠
-

CFI.co于2023年颁赠
-

CFI.co于2023年颁赠
-

交易社区平台FOLLOWME于2022年颁赠
-
2022年迪拜Forex Expo获颁赠
-
2022年迪拜Forex Expo获颁赠
-

荣获Global Forex Awards 2022 — 零售外汇 颁赠
-

CFI.co于2022年颁赠
-

CFI.co于2022年颁赠
-

World Finance Forex Awards 2022 颁发
-

World Finance Forex Awards 2022 颁发
-

World Finance Forex Awards 2022 颁发
-

World Finance Forex Awards 2022 颁发
-
交易社区平台FOLLOWME于2021年颁赠
-

2021年埃及Smart Vision Investment Expo博览会获颁赠
-

CFI.co于2021年颁赠
-

CFI.co于2021年颁赠
-

荣获Global Forex Awards 2021 — 零售外汇 颁赠
-

荣获Global Forex Awards 2021 — 零售外汇 颁赠
-

World Finance 2021颁发
-

World Finance 2021颁发
-
FOLLOWME于2021年颁赠
-

Global Forex Awards 2021 — B2B 颁赠
-

Global Forex Awards颁赠
-

Global Forex Awards颁赠
-

CFI.co于2020年颁赠
-

CFI.co于2020年颁赠
-

荣获Global Business Awards 2020
-

World Finance Magazine 颁赠
World Finance Forex Awards 2020 -

World Finance Magazine 颁赠
World Finance Forex Awards 2020 -
FOLLOWME交易社区授予
-

Global Forex Awards颁赠
-

Global Forex Awards颁赠
-

FinTech Age Awards颁发
-

World Finance Magazine 颁赠
World Finance Forex Awards 2019 -

World Finance Magazine 颁赠
World Finance Forex Awards 2019 -

荣获 World Finance Forex Awards 2018 颁赠
-

荣获2018年埃及金融博览会颁赠
-

荣获 Shares Magazine 的 UK Forex Awards 2017 颁赠
-

荣获 World Finance Forex Awards 2017
-

2016年最佳黄金经纪商
-

2016年最佳外汇经纪商
-

2015年最佳本地客户服务
-

Global Brands Magazine 颁赠
-

Online Money Awards 2022 颁发
-

荣获2022年埃及金融博览会颁赠
-

2015最佳外汇交易平台
-

2015最佳金融交易平台
-

2013最佳创新外汇平台奖
-

2020年 Cyprus HR Awards 颁赠
-

金融行业的佼佼者
-

认证最优金牌级别
-

2014年首届亚军
-
Finance Magnates 颁发
-
Finance Magnates 颁发
-
Capital Finance International Magazine (CFI.co) 2024年颁赠
-
COLWMA 2024年颁赠
-
荣获World Finance Forex Awards 2023最佳外汇客户服务奖
-
荣获World Finance Forex Awards 2023欧洲最佳外汇经纪商奖
-
荣获World Finance Forex Awards 2023澳大拉西亚最佳外汇经纪商奖
-
荣获World Finance Forex Awards 2023拉丁美洲最佳外汇经纪商奖
-
荣获World Finance Forex Awards 2023中东最佳外汇经纪商奖
-
CFI.co于2023年颁赠
-
荣获2023年City of London Wealth Management Awards
-
荣获2022年埃及金融博览会颁赠
-
荣获2022年City of London Wealth Management Awards
-
CFI.co于2022年颁赠
-
荣获Global Forex Awards 2022 — 零售外汇 颁赠
-
2021年迪拜外汇博览会获颁赠
-
Ultimate Fintech 2021年颁赠
-
荣获2021年City of London Wealth Management Awards
-
FX168于2020年12月颁赠
-
荣获Global Business Awards 2020
-
荣获2020年City of London Wealth Management Awards
-
Capital Finance International Magazine (CFI.co)颁赠
-
Capital Finance International Magazine (CFI.co)颁赠
-
荣获2019年City of London Wealth Management Awards
-
Shares Magazine 授予 UK Forex Awards 2018
-
Capital Finance International Magazine (CFI.co)颁赠
-
Capital Finance International Magazine (CFI.co)颁赠
-
2017年伦敦财富管理奖
-
2016最佳本土 客户服务
-
中东和北非地区(MENA)增长最快的经纪商
-
2015年最佳外汇科技提供商
-
2014年最佳外汇科技提供商
-
2014年最佳外汇科技提供商
-
荣获 The Trading Show 2024年非洲 Africa Fintech 峰会颁赠
-
荣获2024年中东地区 Brokersview 颁赠
-
荣获2024年中东地区 Brokersview 颁赠
-
荣获2024年阿曼 Smart Vision 峰会颁赠
-
荣获2024年迪拜外汇博览会颁赠
-
荣获2024年迪拜 Forex Traders Summit 颁赠
-
2024年埃及 Smart Vision 峰会颁赠
-
投查查于2024年颁赠
-
Capital Finance International Magazine (CFI.co) 2024年颁赠
-
CFI.co于2023年颁赠
-
CFI.co于2023年颁赠
-
交易社区平台FOLLOWME于2022年颁赠
-
2022年迪拜Forex Expo获颁赠
-
2022年迪拜Forex Expo获颁赠
-
荣获Global Forex Awards 2022 — 零售外汇 颁赠
-
CFI.co于2022年颁赠
-
CFI.co于2022年颁赠
-
World Finance Forex Awards 2022 颁发
-
World Finance Forex Awards 2022 颁发
-
World Finance Forex Awards 2022 颁发
-
World Finance Forex Awards 2022 颁发
-
交易社区平台FOLLOWME于2021年颁赠
-
2021年埃及Smart Vision Investment Expo博览会获颁赠
-
CFI.co于2021年颁赠
-
CFI.co于2021年颁赠
-
荣获Global Forex Awards 2021 — 零售外汇 颁赠
-
荣获Global Forex Awards 2021 — 零售外汇 颁赠
-
World Finance 2021颁发
-
World Finance 2021颁发
-
FOLLOWME于2021年颁赠
-
Global Forex Awards 2021 — B2B 颁赠
-
Global Forex Awards颁赠
-
Global Forex Awards颁赠
-
CFI.co于2020年颁赠
-
CFI.co于2020年颁赠
-
荣获Global Business Awards 2020
-
World Finance Magazine 颁赠
World Finance Forex Awards 2020 -
World Finance Magazine 颁赠
World Finance Forex Awards 2020 -
FOLLOWME交易社区授予
-
Global Forex Awards颁赠
-
Global Forex Awards颁赠
-
FinTech Age Awards颁发
-
World Finance Magazine 颁赠
World Finance Forex Awards 2019 -
World Finance Magazine 颁赠
World Finance Forex Awards 2019 -
荣获 World Finance Forex Awards 2018 颁赠
-
荣获2018年埃及金融博览会颁赠
-
荣获 Shares Magazine 的 UK Forex Awards 2017 颁赠
-
荣获 World Finance Forex Awards 2017
-
2016年最佳黄金经纪商
-
2016年最佳外汇经纪商
-
2015年最佳本地客户服务
-
Global Brands Magazine 颁赠
-
Online Money Awards 2022 颁发
-
荣获2022年埃及金融博览会颁赠
-
2015最佳外汇交易平台
-
2015最佳金融交易平台
-
2013最佳创新外汇平台奖
-
2020年 Cyprus HR Awards 颁赠
-
金融行业的佼佼者
-
认证最优金牌级别
-
2014年首届亚军

Awarded BestBrokerYear After Year
CATEGORIES
News
- 【XM Forex】--USD/SGD Analysis: Nervous Tight Range as Outlook Remains Challenging
- 【XM Group】--GBP/USD Forecast: Struggles Against the Dollar
- 【XM Forex】--FTSE Forecast: Consolidates, Eyes Breakout Above 8600
- 【XM Market Analysis】--USD/ZAR Analysis: Climb to Start the Day as Volume Set to
- 【XM Market Analysis】--USD/MYR Forex Signal: Poised for Breakout
market analysis
High cross waiting for non-agricultural areas, high altitudes in gold and silver range
Wonderful introduction:
Optimism is the line of egrets that are straight up to the blue sky, optimism is the ten thousand white sails beside the sunken boat, optimism is the lush grass that blows with the wind on the head of the parrot island, optimism is the falling red spots that turn into spring mud to protect the flowers.
Hello everyone, today XM Foreign Exchange will bring you "[XM Foreign Exchange Market Review]: High cross waiting for non-agricultural areas, high altitudes in gold and silver ranges". Hope it will be helpful to you! The original content is as follows:
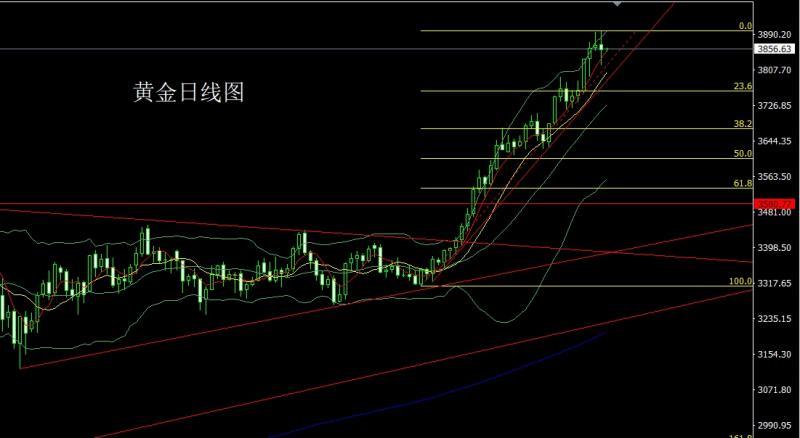
Yesterday, the gold market opened at 3866.4 and then the market fell first, and then the market rose strongly. The daily line hit a record high of 3897.3 and then the market took profit and fell strongly. During the US session, the daily line was at the lowest point of 3819 and then rose strongly in the late trading. The daily line finally closed at 3854.7 and then the daily line was a long-leg cross with a lower shadow line slightly longer than the upper shadow line. The star pattern closes, and after the end of this pattern, the longs of 3325 and 3322 below and the longs of 3368-3370 last week, and the longs of 3377 and 3385 longs and 3563 longs and 3563 longs and 3650 were reduced. Today, the first pull-up gave 3890 shorts and 3893 shorts and 3898 shorts. The target is 3882 and 3872 and 3861 and 3852 and 3843-3832.
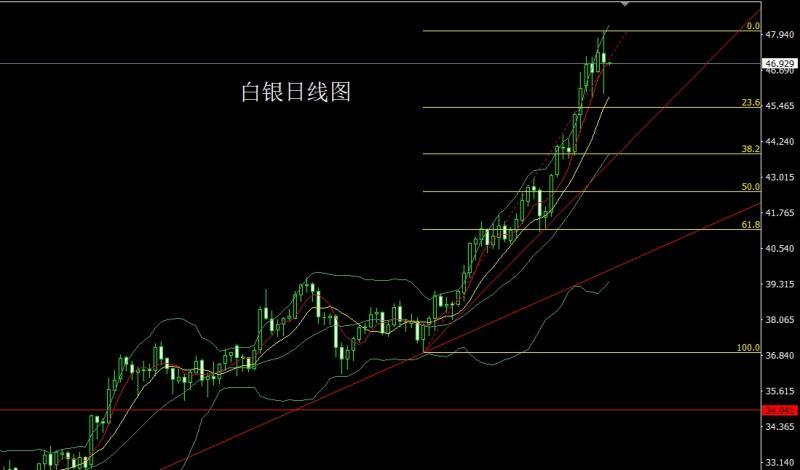
The silver market opened at 47.293 yesterday and then fell back first. The market rose strongly. The daily line reached the highest position of 48.046 and then fell strongly. The daily line was at the lowest position of 45.886 and then the market consolidated. The daily line finally closed at 46.972. The daily line closed in a long-foot spindle pattern with a lower shadow line slightly longer than the upper shadow line. After this pattern ended, the long position of 37.8 and the long position of 38.8 below were reduced and the stop loss followed up at 42. After reducing positions at 44.6 last FridayStop loss follow-up is held at 44.8, today's 47.9 short stop loss 48.1 target is 47.2 and 46.6 and 46.1.
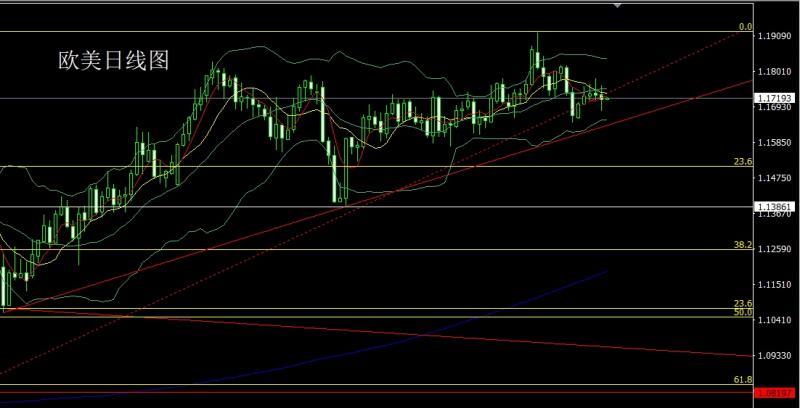
European and American markets opened at 1.17300 yesterday and the market first rose to 1.17584, and then the market fell strongly. The daily line was at the lowest point of 1.16818 and then the market consolidated. After the daily line finally closed at 1.17153, the daily line closed in a spindle pattern with a lower shadow line slightly longer than the upper shadow line. After this pattern ended, today, 1.17450 short stop loss was 1.17650, the target was 1.17100 and 1.16800, and the break below 1.16600 and 1.16400.
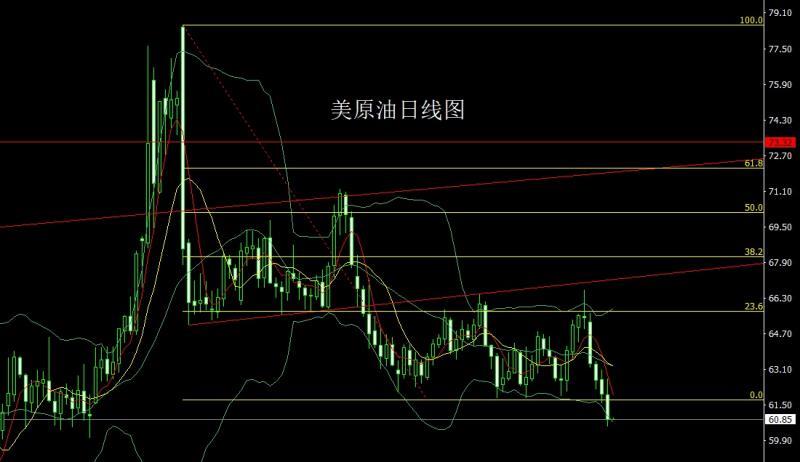
The U.S. crude oil market opened at 61.94 yesterday and the market first rose. The daily line was high at 62.68 and then fell strongly. The daily line fell below the previous three-bottom support 61.7, and the market accelerated to fall. The daily line was at the lowest point of 60.52, and the market consolidated. After the daily line finally closed at 60.83, the daily line closed with a large negative line with a long upper shadow line. After this pattern ended, the daily line effectively broke the support and fell back today. At the point, the stop loss of 62.3 yesterday was followed by a short position of 62.1, and the target was 60.8 and 60.5, and the break below 60 and 59.6-59.2.
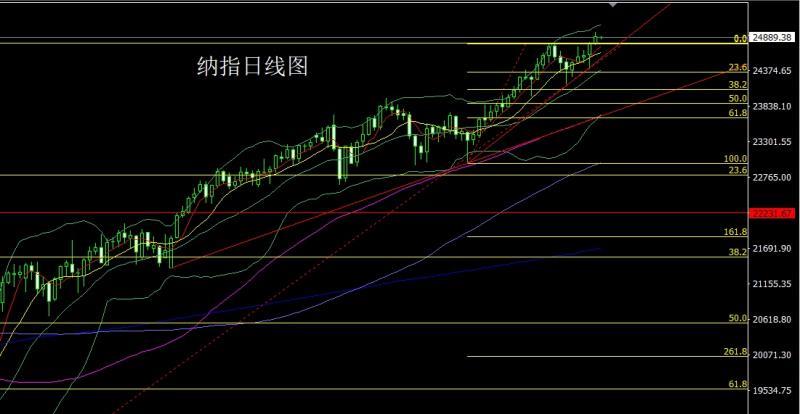
Nasdaq market opened at 24789.3 yesterday, and the market rose first, giving a position of 24964.98. Then the market fell strongly. The daily line was at the lowest point of 24776.4. After the market was consolidated, the daily line finally closed at 24893.52. After the daily line closed with a medium-positive line with a long upper shadow line. After this pattern ended, the stop loss of more than 24800 today was 24750, with the target of 24900 and 24960 and 25000-25100.
The fundamentals, yesterday's fundamentals were affected by the shutdown of the US government. The number of unemployment claims applicants, the monthly rate of US factory orders and the monthly rate of durable goods orders were all delayed by the announcement of the week from September 27. But for September non-farm data, US media reported that the Bureau of Labor Statistics may be ready for release, and Senator Warren called on the government to release non-farm data "as scheduled" on Friday. Fed Logan said the unemployment rate is expected to rise slightly, but not too high. The policy is only slightly tightened, which is just right. We need to be highly cautious about interest rate cuts and must not be overly relaxed, otherwise we will have to reverse the policy. Goulsby said he should be cautious about avoiding excessive early cuts. If the official unemployment rate is not availableAccording to the Federal Reserve, the Federal Reserve will make a decision based on the information it has. Becente said the first round of interviews for the Fed's chairman candidate will be www.xmtraders.completed next week and the government's suspension may impact GDP. Today's fundamentals focus mainly on the US September unemployment rate at 20:30 and the US September seasonally adjusted non-farm employment population. This round is expected to be 4.3% and 50,000 people. Look at the final value of the US S&P Global Services PMI in September at 21:45 and the US ISM non-manufacturing PMI in September at 22:00.
In terms of operation, gold: 3325 and 3322 long below and 3370 long last week and 3377 and 3385 long and 3563 long last week, and the stop loss followed by holding at 3650. Today, the first pull-up gave 3890 short conservative 3893 short stop loss 3898, and the target was 3882 and 3872 and 3861 and 3852 and 3843-3832.
Silver: 37.8 long and 38.8 long below and 38.8 long below and 38.8 long below and 42 stop loss followed by holding at 42. Last Friday, the stop loss followed by 44.6 after reducing positions at 44.8, and today's 47.9 short stop loss 48.1 targeted at 47.2 and 46.6 and 46.1.
Europe and the United States: 1.17450 short stop loss 1.17650, the targeted at 1.17100 and 1.16800, and the falling below 1.16600 and 1.16400.
U.S. crude oil: 62.3 short stop loss yesterday followed by 62.1, and today's 61.6 short stop Loss 62.1, target 60.8 and 60.5, break below 60 and 59.6-59.2.
Nasdaq Index: Today, the stop loss is 24,800 or more than 24,750, target 24,900 and 24,960 and 25,000-25,100.
The above content is all about "[XM Foreign Exchange Market Review]: High cross waiting for non-agricultural areas, gold and silver range is high and altitude", which was carefully www.xmtraders.compiled and edited by the editor of XM Foreign Exchange. I hope it will be helpful to your trading! Thanks for the support!
Spring, summer, autumn and winter, every season is a beautiful scenery, and it stays in my heart forever. Leave~~~
Disclaimers: XM Group only provides execution services and access permissions for online trading platforms, and allows individuals to view and/or use the website or the content provided on the website, but has no intention of making any changes or extensions, nor will it change or extend its services and access permissions. All access and usage permissions will be subject to the following terms and conditions: (i) Terms and conditions; (ii) Risk warning; And (iii) a complete disclaimer. Please note that all information provided on the website is for general informational purposes only. In addition, the content of all XM online trading platforms does not constitute, and cannot be used for any unauthorized financial market trading invitations and/or invitations. Financial market transactions pose significant risks to your investment capital.
All materials published on online trading platforms are only intended for educational/informational purposes and do not include or should be considered for financial, investment tax, or trading related consulting and advice, or transaction price records, or any financial product or non invitation related trading offers or invitations.
All content provided by XM and third-party suppliers on this website, including opinions, news, research, analysis, prices, other information, and third-party website links, remains unchanged and is provided as general market commentary rather than investment advice. All materials published on online trading platforms are only for educational/informational purposes and do not include or should be considered as applicable to financial, investment tax, or trading related advice and recommendations, or transaction price records, or any financial product or non invitation related financial offers or invitations. Please ensure that you have read and fully understood the information on XM's non independent investment research tips and risk warnings. For more details, please click here