


Trusted by over 15 Million Traders
The Most Awarded Broker
for a Reason
Easy Access to 1,400+ Global Assets
EURUSD
Euro vs U.S. Dollar
US500
S&P 500 (US500)
GOLD
Gold
COFFEE
US Coffee
Apple
Apple (AAPL.OQ)
-

Finance Magnates 颁发
-

Finance Magnates 颁发
-

Capital Finance International Magazine (CFI.co) 2024年颁赠
-

COLWMA 2024年颁赠
-

荣获World Finance Forex Awards 2023最佳外汇客户服务奖
-

荣获World Finance Forex Awards 2023欧洲最佳外汇经纪商奖
-

荣获World Finance Forex Awards 2023澳大拉西亚最佳外汇经纪商奖
-

荣获World Finance Forex Awards 2023拉丁美洲最佳外汇经纪商奖
-

荣获World Finance Forex Awards 2023中东最佳外汇经纪商奖
-

CFI.co于2023年颁赠
-

荣获2023年City of London Wealth Management Awards
-

荣获2022年埃及金融博览会颁赠
-

荣获2022年City of London Wealth Management Awards
-

CFI.co于2022年颁赠
-

荣获Global Forex Awards 2022 — 零售外汇 颁赠
-
2021年迪拜外汇博览会获颁赠
-

Ultimate Fintech 2021年颁赠
-

荣获2021年City of London Wealth Management Awards
-

FX168于2020年12月颁赠
-

荣获Global Business Awards 2020
-

荣获2020年City of London Wealth Management Awards
-

Capital Finance International Magazine (CFI.co)颁赠
-

Capital Finance International Magazine (CFI.co)颁赠
-

荣获2019年City of London Wealth Management Awards
-

Shares Magazine 授予 UK Forex Awards 2018
-

Capital Finance International Magazine (CFI.co)颁赠
-

Capital Finance International Magazine (CFI.co)颁赠
-

2017年伦敦财富管理奖
-

2016最佳本土 客户服务
-

中东和北非地区(MENA)增长最快的经纪商
-
2015年最佳外汇科技提供商
-
2014年最佳外汇科技提供商
-

2014年最佳外汇科技提供商
-

荣获 The Trading Show 2024年非洲 Africa Fintech 峰会颁赠
-

荣获2024年中东地区 Brokersview 颁赠
-
荣获2024年中东地区 Brokersview 颁赠
-

荣获2024年阿曼 Smart Vision 峰会颁赠
-

荣获2024年迪拜外汇博览会颁赠
-

荣获2024年迪拜 Forex Traders Summit 颁赠
-

2024年埃及 Smart Vision 峰会颁赠
-

投查查于2024年颁赠
-

Capital Finance International Magazine (CFI.co) 2024年颁赠
-

CFI.co于2023年颁赠
-

CFI.co于2023年颁赠
-

交易社区平台FOLLOWME于2022年颁赠
-
2022年迪拜Forex Expo获颁赠
-
2022年迪拜Forex Expo获颁赠
-

荣获Global Forex Awards 2022 — 零售外汇 颁赠
-

CFI.co于2022年颁赠
-

CFI.co于2022年颁赠
-

World Finance Forex Awards 2022 颁发
-

World Finance Forex Awards 2022 颁发
-

World Finance Forex Awards 2022 颁发
-

World Finance Forex Awards 2022 颁发
-
交易社区平台FOLLOWME于2021年颁赠
-

2021年埃及Smart Vision Investment Expo博览会获颁赠
-

CFI.co于2021年颁赠
-

CFI.co于2021年颁赠
-

荣获Global Forex Awards 2021 — 零售外汇 颁赠
-

荣获Global Forex Awards 2021 — 零售外汇 颁赠
-

World Finance 2021颁发
-

World Finance 2021颁发
-
FOLLOWME于2021年颁赠
-

Global Forex Awards 2021 — B2B 颁赠
-

Global Forex Awards颁赠
-

Global Forex Awards颁赠
-

CFI.co于2020年颁赠
-

CFI.co于2020年颁赠
-

荣获Global Business Awards 2020
-

World Finance Magazine 颁赠
World Finance Forex Awards 2020 -

World Finance Magazine 颁赠
World Finance Forex Awards 2020 -
FOLLOWME交易社区授予
-

Global Forex Awards颁赠
-

Global Forex Awards颁赠
-

FinTech Age Awards颁发
-

World Finance Magazine 颁赠
World Finance Forex Awards 2019 -

World Finance Magazine 颁赠
World Finance Forex Awards 2019 -

荣获 World Finance Forex Awards 2018 颁赠
-

荣获2018年埃及金融博览会颁赠
-

荣获 Shares Magazine 的 UK Forex Awards 2017 颁赠
-

荣获 World Finance Forex Awards 2017
-

2016年最佳黄金经纪商
-

2016年最佳外汇经纪商
-

2015年最佳本地客户服务
-

Global Brands Magazine 颁赠
-

Online Money Awards 2022 颁发
-

荣获2022年埃及金融博览会颁赠
-

2015最佳外汇交易平台
-

2015最佳金融交易平台
-

2013最佳创新外汇平台奖
-

2020年 Cyprus HR Awards 颁赠
-

金融行业的佼佼者
-

认证最优金牌级别
-

2014年首届亚军
-
Finance Magnates 颁发
-
Finance Magnates 颁发
-
Capital Finance International Magazine (CFI.co) 2024年颁赠
-
COLWMA 2024年颁赠
-
荣获World Finance Forex Awards 2023最佳外汇客户服务奖
-
荣获World Finance Forex Awards 2023欧洲最佳外汇经纪商奖
-
荣获World Finance Forex Awards 2023澳大拉西亚最佳外汇经纪商奖
-
荣获World Finance Forex Awards 2023拉丁美洲最佳外汇经纪商奖
-
荣获World Finance Forex Awards 2023中东最佳外汇经纪商奖
-
CFI.co于2023年颁赠
-
荣获2023年City of London Wealth Management Awards
-
荣获2022年埃及金融博览会颁赠
-
荣获2022年City of London Wealth Management Awards
-
CFI.co于2022年颁赠
-
荣获Global Forex Awards 2022 — 零售外汇 颁赠
-
2021年迪拜外汇博览会获颁赠
-
Ultimate Fintech 2021年颁赠
-
荣获2021年City of London Wealth Management Awards
-
FX168于2020年12月颁赠
-
荣获Global Business Awards 2020
-
荣获2020年City of London Wealth Management Awards
-
Capital Finance International Magazine (CFI.co)颁赠
-
Capital Finance International Magazine (CFI.co)颁赠
-
荣获2019年City of London Wealth Management Awards
-
Shares Magazine 授予 UK Forex Awards 2018
-
Capital Finance International Magazine (CFI.co)颁赠
-
Capital Finance International Magazine (CFI.co)颁赠
-
2017年伦敦财富管理奖
-
2016最佳本土 客户服务
-
中东和北非地区(MENA)增长最快的经纪商
-
2015年最佳外汇科技提供商
-
2014年最佳外汇科技提供商
-
2014年最佳外汇科技提供商
-
荣获 The Trading Show 2024年非洲 Africa Fintech 峰会颁赠
-
荣获2024年中东地区 Brokersview 颁赠
-
荣获2024年中东地区 Brokersview 颁赠
-
荣获2024年阿曼 Smart Vision 峰会颁赠
-
荣获2024年迪拜外汇博览会颁赠
-
荣获2024年迪拜 Forex Traders Summit 颁赠
-
2024年埃及 Smart Vision 峰会颁赠
-
投查查于2024年颁赠
-
Capital Finance International Magazine (CFI.co) 2024年颁赠
-
CFI.co于2023年颁赠
-
CFI.co于2023年颁赠
-
交易社区平台FOLLOWME于2022年颁赠
-
2022年迪拜Forex Expo获颁赠
-
2022年迪拜Forex Expo获颁赠
-
荣获Global Forex Awards 2022 — 零售外汇 颁赠
-
CFI.co于2022年颁赠
-
CFI.co于2022年颁赠
-
World Finance Forex Awards 2022 颁发
-
World Finance Forex Awards 2022 颁发
-
World Finance Forex Awards 2022 颁发
-
World Finance Forex Awards 2022 颁发
-
交易社区平台FOLLOWME于2021年颁赠
-
2021年埃及Smart Vision Investment Expo博览会获颁赠
-
CFI.co于2021年颁赠
-
CFI.co于2021年颁赠
-
荣获Global Forex Awards 2021 — 零售外汇 颁赠
-
荣获Global Forex Awards 2021 — 零售外汇 颁赠
-
World Finance 2021颁发
-
World Finance 2021颁发
-
FOLLOWME于2021年颁赠
-
Global Forex Awards 2021 — B2B 颁赠
-
Global Forex Awards颁赠
-
Global Forex Awards颁赠
-
CFI.co于2020年颁赠
-
CFI.co于2020年颁赠
-
荣获Global Business Awards 2020
-
World Finance Magazine 颁赠
World Finance Forex Awards 2020 -
World Finance Magazine 颁赠
World Finance Forex Awards 2020 -
FOLLOWME交易社区授予
-
Global Forex Awards颁赠
-
Global Forex Awards颁赠
-
FinTech Age Awards颁发
-
World Finance Magazine 颁赠
World Finance Forex Awards 2019 -
World Finance Magazine 颁赠
World Finance Forex Awards 2019 -
荣获 World Finance Forex Awards 2018 颁赠
-
荣获2018年埃及金融博览会颁赠
-
荣获 Shares Magazine 的 UK Forex Awards 2017 颁赠
-
荣获 World Finance Forex Awards 2017
-
2016年最佳黄金经纪商
-
2016年最佳外汇经纪商
-
2015年最佳本地客户服务
-
Global Brands Magazine 颁赠
-
Online Money Awards 2022 颁发
-
荣获2022年埃及金融博览会颁赠
-
2015最佳外汇交易平台
-
2015最佳金融交易平台
-
2013最佳创新外汇平台奖
-
2020年 Cyprus HR Awards 颁赠
-
金融行业的佼佼者
-
认证最优金牌级别
-
2014年首届亚军

Awarded BestBrokerYear After Year
CATEGORIES
News
- 【XM Group】--Gold Analysis: Market Performance Affected by Weak Liquidity
- 【XM Decision Analysis】--USD/JPY Analysis: Path to 160.00 Peak is Paved
- 【XM Forex】--USD/MXN Forecast: US Dollar Rallies Against Mexican Peso After FOMC
- 【XM Market Analysis】--EUR/USD Forecast: Euro Continues to Wait for Move
- 【XM Group】--EUR/USD Forecast: Euro Gains Amid Dollar Weakness
market analysis
Gold 3900 finally ushered in a wave of correction, testing the daily 10 moving average on Friday
Wonderful Introduction:
I missed more in life than I have not missed, and everyone has missed countless times. So we don’t have to apologize for our misses, we should be happy for our own possession. Missing beauty, you have health: Missing health, you have wisdom; missing wisdom, you have kindness; missing kindness, you have wealth; missing wealth, you have www.xmtraders.comfort; missing www.xmtraders.comfort, you have freedom; missing freedom, you have personality...
Hello everyone, today XM Foreign Exchange will bring you "[XM Foreign Exchange Platform]: Gold 3900 has finally ushered in a wave of corrections, and test the daily 10 moving average on Friday." Hope it will be helpful to you! The original content is as follows:
Zheng's silver point: Gold 3900 has finally ushered in a wave of corrections. On Friday, we test the daily 10 moving average.
National Day holiday, a rare opportunity and time to accompany our family to walk around, so the research reports will be later in the past few days, and there will be less dynamic analysis and updates. Please forgive me! Continue to wish all friends a happy National Day!
Review the market trends in the past two days:
First, in terms of gold: On Wednesday, October 1, pierced the previous day's high point in the morning, and after rising and falling, it was unable to effectively lose the hourly line 10 moving average many times. After several hours of round trip, the European session hit a wave of 3895. It is emphasized that every time it touches the integer mark, you must be careful of a pullback, and the daily line has not fallen back to confirm the 5 moving average to exert force, so it is possible to directly pull up and tempt investors to chase the rise at a high level, which is easy to rise and fall; Sure enough, the second half of the night fluctuates and lowers, and returns to the daily low point of 3853 in the day; October 2 Yesterday morning analysis, since the daily line closed at a top long shadow K, it is predicted that the day rebounded to a second high point and then rose and fell back to correct to the 5 moving average, or 10 moving average, and then stabilized and rose; in the morning, the 3880 first-line sniper band was ambushed in advance, and it was the 618 division position, and it was also the sideways resistance level that rebounded after the 21 o'clock negative in the US session yesterday, and the defense was at the 3900 mark; although the European session was a continuous positive rise, after the US session hit the 3897 first-line high point, a wave of smashing and plunging finally occurred, which is the emphasized temptation to absorb funds and chase the rise, and the short-squeezing sentiment is in place, insisting onNext, we reached the expected target of 3830-20 band to win the closing;
Second, silver: the day before yesterday was the same as gold, and we made another profit in the morning to hedge several bottom positions in our hands, medium- and long-term bullish positions, to prevent the short-term dive corrections that appear later. Today, it is still here; and yesterday there was no chance to draw pictures on the www.xmtraders.computer during the day, so we didn't make layouts. When we came back, we were the 48 high and the upper track resistance level in the following figure, which was not bad at all;
Today's market analysis and interpretation:
First, gold daily line level: yesterday's high and fell, closing the long upper shadow under pressure K, today it was still rising and falling, and the pressure was greater than yesterday, and the current pattern is negative The line, which is considered to be a retracement, confirmed the 5 moving average 3830-20, which is also the bearish target of the band mentioned during the day. Originally, we could plan to turn backwards and stabilize, but because it was in the second half of the night, we gave up temporarily, because the trend pattern of the two days was almost the same as September 16 and 17. We first first the top shadow line of the positive K, then close the negative, and the low point fell back for 5 days. Then according to this cycle, there is a high probability that we will test the vicinity of the 10 moving average on Friday, and it is expected to move upwards to 3800-3790. There is a signal of intraday sideways stable stability and stabilization, and we can return to continue to look bullish and go all the way higher; if the 10 moving average is large negative and continues to fall, it will further fall, and move closer to the middle track or pierce the middle track for a The second slightly larger correction, after all, from the bottom of 3311 to 3897, this wave is close to 600 meters, and there is no decent correction in the middle. Like September 17 and September 24, it is not considered a formal correction. It tends to be strongly consolidated at high-level boxes, because the 10 moving average has not been effectively lost, and it has been in a short squeeze state. Therefore, to summarize, the daily line level will first test the 10 moving average tomorrow, and continue to look at the short-term correction, about 3800-3790; if the 10 moving average is maintained, it will continue to return to the trend and be bullish next week; if the 10 moving average cannot be maintained, it will further lower, which will be the first slightly larger correction since the bottom of 3311, point to the middle track or pierce the middle track, and stabilize again. The road goes up one side, and then goes up to 3900 to hit the 4000 mark;
Second, gold 4-hour level: tonight, the middle track has a big negative downward, the 3850 line will become a counter-pressure point, and if it cannot break through again, it will further fall and fall, and gradually test the 66-day moving average. As time continues, on Friday, the moving average is expected to move up by about 3875, which is to pierce the daily 10 moving average; then it will look at the release of non-agricultural data, but the initial unemployment claim for last night has not been announced yet, and non-agricultural may not be announced. If so, be careful to make trouble on the weekend, which will affect the opening action next Monday;
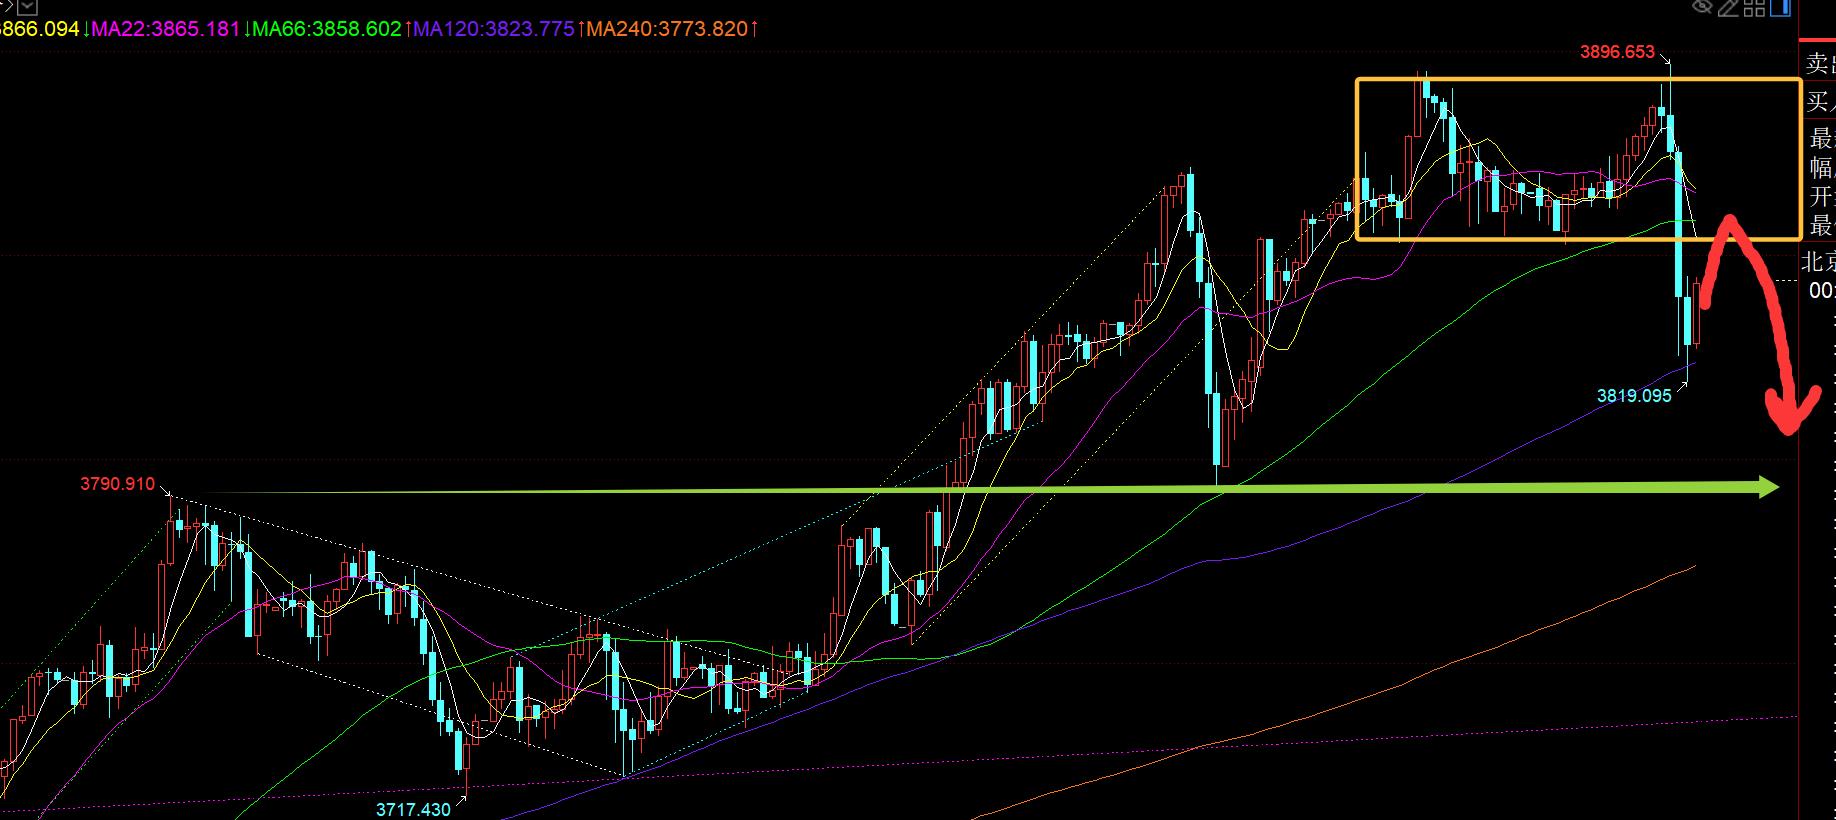
Third, golden hourly line level: From the above picture, the high-level box consolidation range of 3853-3897 was broken, 38The 53 line becomes a certain counter-pressure, and after the 66-day moving average falls, it also becomes a counter-pressure, about 3858 line; therefore, after a wave of decline and diving, 3853-58 and others are under pressure after touching the early trading, you can continue to fall bearishly and fall, which is also the 50-dividing resistance level. Focus on the green line support above 3790. If you cannot hold it, you cannot hold the daily 10 moving average, which will further expand the downward correction strength; if you can hold it, you can backhand and be bullish at a low level; in addition, you should also pay attention to the support of the annual moving average, which is the next key support that can be reached after punctured through 3790. On September 18, it was down to stabilize the annual moving average and then ushered in a round of strong unilateral attacks. Therefore, after the Asian session opened in the morning, it first hit 3853-58 under pressure and bearish decline, and continued to lower. If the hourly line breaks through the above 3858, it is necessary to adjust its position. The target below is 3800-3790, and then observe the effective gains and losses of 3790. If it pierces, pay attention to the support and stabilization signal of the annual moving average. Only when the short-term downward correction is in place can we continue to have the courage, strength, and sustainability to see the continuation of the unilateral rise;
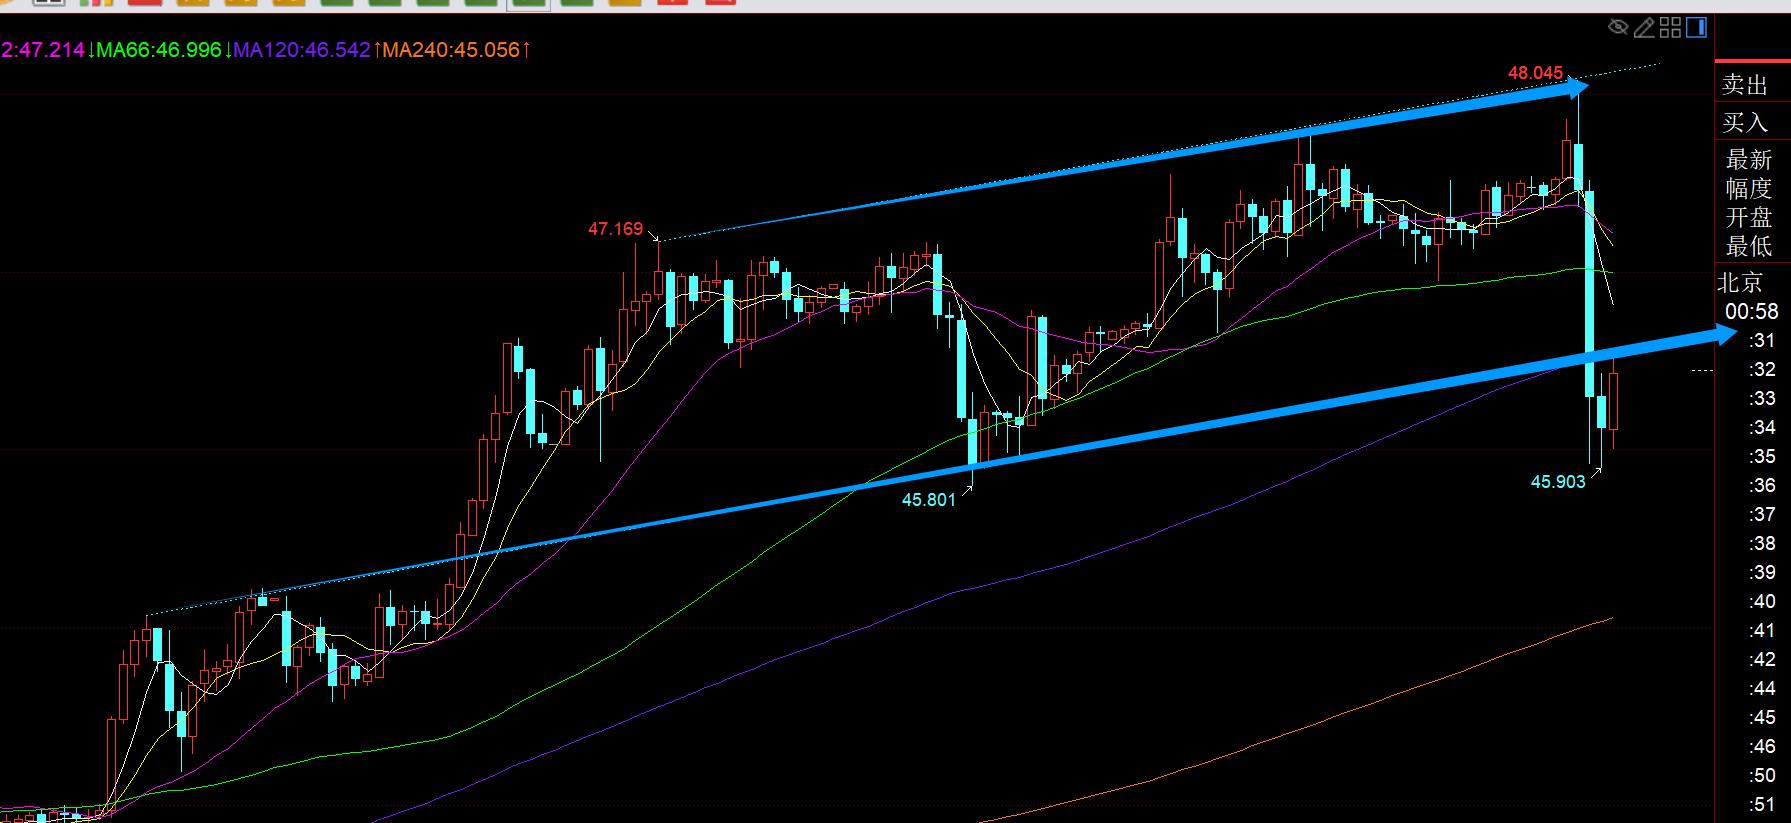
Silver: Tonight, there is also a dive, with a very strong force, which is 2 yuan directly; from the above picture, in fact, from the perspective of the channel, the 48 line is exactly the upper track of the blue channel, and the lower track support has broken at this time, and the resistance confirmed by the rebound is the 46.58-46.6 line. When the early rebound, it will still be under pressure around 10 o'clock, and it will continue to suppress the downward trend. Pay attention to the stability of the support 45.8 and 45 below; if 46.6 breaks through, return to In the channel, the 47 line also has resistance, and this is also a strong feng shui hill. If it breaks through again, it will be a strong way to hit the upper track. The silver hourly line macd is almost repaired, but it is still a little bit short of 2 hours, so it still needs to be corrected for the oscillation and decline. The daily line will probably pierce the 10 moving average before looking at the stabilization signal; the bull trend has remained unchanged, and the adjustment and correction is also to further attack in the future and break through the historical high before 49.8;

Crude oil: Today, it fell, and fell below the previous support position 61.4, and also went out of the wide fluctuation range of 61-66; so at the moment, the short-term trend is still weak. From the above figure, it is running around the yellow downward channel, and the lower track has broken. You may pay attention to the support at the 60 mark below, and the resistance is below 61.9-62;
The above are several points of the author's technical analysis, as a reference, and it is also the summary of technical experience accumulated by the market for more than 12 hours a day in the past twelve years. Technical points are disclosed every day, and text and video interpretations are interpreted. Friends who want to learn can www.xmtraders.compare and refer to the actual trend. Those who recognize ideas can refer to operations and lead a good defense.Risk control is the first priority; if you don’t agree, just pretend to be bye bye; thank you for your support and attention;
[The article views are for reference only. Investment is risky. You need to be cautious when entering the market, rationally operate, strictly set losses, control positions, risk control is the first, and you will be responsible for your own profits and losses]
Contributor: Zheng’s Dianyin
A study on the market for more than 12 hours a day, persisting for ten years, and detailed technical interpretations are made public on the entire network, serving the whole network with sincerity, sincerity, perseverance and wholeheartedness! www.xmtraders.comments written on major financial websites! Proficient in the K-line rules, channel rules, time rules, moving average rules, segmentation rules, and top and bottom rules; student cooperation registration hotline - WeChat: zdf289984986
The above content is about "[XM Foreign Exchange Platform]: Gold 3900 has finally ushered in a wave of corrections, and test the daily 10 moving average on Friday" is carefully www.xmtraders.compiled and edited by the editor of XM Foreign Exchange. I hope it will be helpful to your trading! Thanks for the support!
Due to the author's limited ability and time constraints, some content in the article still needs to be discussed and studied in depth. Therefore, in the future, the author will conduct extended research and discussion on the following issues:
Disclaimers: XM Group only provides execution services and access permissions for online trading platforms, and allows individuals to view and/or use the website or the content provided on the website, but has no intention of making any changes or extensions, nor will it change or extend its services and access permissions. All access and usage permissions will be subject to the following terms and conditions: (i) Terms and conditions; (ii) Risk warning; And (iii) a complete disclaimer. Please note that all information provided on the website is for general informational purposes only. In addition, the content of all XM online trading platforms does not constitute, and cannot be used for any unauthorized financial market trading invitations and/or invitations. Financial market transactions pose significant risks to your investment capital.
All materials published on online trading platforms are only intended for educational/informational purposes and do not include or should be considered for financial, investment tax, or trading related consulting and advice, or transaction price records, or any financial product or non invitation related trading offers or invitations.
All content provided by XM and third-party suppliers on this website, including opinions, news, research, analysis, prices, other information, and third-party website links, remains unchanged and is provided as general market commentary rather than investment advice. All materials published on online trading platforms are only for educational/informational purposes and do not include or should be considered as applicable to financial, investment tax, or trading related advice and recommendations, or transaction price records, or any financial product or non invitation related financial offers or invitations. Please ensure that you have read and fully understood the information on XM's non independent investment research tips and risk warnings. For more details, please click here