


Trusted by over 15 Million Traders
The Most Awarded Broker
for a Reason
Easy Access to 1,400+ Global Assets
EURUSD
Euro vs U.S. Dollar
US500
S&P 500 (US500)
GOLD
Gold
COFFEE
US Coffee
Apple
Apple (AAPL.OQ)
-

Finance Magnates 颁发
-

Finance Magnates 颁发
-

Capital Finance International Magazine (CFI.co) 2024年颁赠
-

COLWMA 2024年颁赠
-

荣获World Finance Forex Awards 2023最佳外汇客户服务奖
-

荣获World Finance Forex Awards 2023欧洲最佳外汇经纪商奖
-

荣获World Finance Forex Awards 2023澳大拉西亚最佳外汇经纪商奖
-

荣获World Finance Forex Awards 2023拉丁美洲最佳外汇经纪商奖
-

荣获World Finance Forex Awards 2023中东最佳外汇经纪商奖
-

CFI.co于2023年颁赠
-

荣获2023年City of London Wealth Management Awards
-

荣获2022年埃及金融博览会颁赠
-

荣获2022年City of London Wealth Management Awards
-

CFI.co于2022年颁赠
-

荣获Global Forex Awards 2022 — 零售外汇 颁赠
-
2021年迪拜外汇博览会获颁赠
-

Ultimate Fintech 2021年颁赠
-

荣获2021年City of London Wealth Management Awards
-

FX168于2020年12月颁赠
-

荣获Global Business Awards 2020
-

荣获2020年City of London Wealth Management Awards
-

Capital Finance International Magazine (CFI.co)颁赠
-

Capital Finance International Magazine (CFI.co)颁赠
-

荣获2019年City of London Wealth Management Awards
-

Shares Magazine 授予 UK Forex Awards 2018
-

Capital Finance International Magazine (CFI.co)颁赠
-

Capital Finance International Magazine (CFI.co)颁赠
-

2017年伦敦财富管理奖
-

2016最佳本土 客户服务
-

中东和北非地区(MENA)增长最快的经纪商
-
2015年最佳外汇科技提供商
-
2014年最佳外汇科技提供商
-

2014年最佳外汇科技提供商
-

荣获 The Trading Show 2024年非洲 Africa Fintech 峰会颁赠
-

荣获2024年中东地区 Brokersview 颁赠
-
荣获2024年中东地区 Brokersview 颁赠
-

荣获2024年阿曼 Smart Vision 峰会颁赠
-

荣获2024年迪拜外汇博览会颁赠
-

荣获2024年迪拜 Forex Traders Summit 颁赠
-

2024年埃及 Smart Vision 峰会颁赠
-

投查查于2024年颁赠
-

Capital Finance International Magazine (CFI.co) 2024年颁赠
-

CFI.co于2023年颁赠
-

CFI.co于2023年颁赠
-

交易社区平台FOLLOWME于2022年颁赠
-
2022年迪拜Forex Expo获颁赠
-
2022年迪拜Forex Expo获颁赠
-

荣获Global Forex Awards 2022 — 零售外汇 颁赠
-

CFI.co于2022年颁赠
-

CFI.co于2022年颁赠
-

World Finance Forex Awards 2022 颁发
-

World Finance Forex Awards 2022 颁发
-

World Finance Forex Awards 2022 颁发
-

World Finance Forex Awards 2022 颁发
-
交易社区平台FOLLOWME于2021年颁赠
-

2021年埃及Smart Vision Investment Expo博览会获颁赠
-

CFI.co于2021年颁赠
-

CFI.co于2021年颁赠
-

荣获Global Forex Awards 2021 — 零售外汇 颁赠
-

荣获Global Forex Awards 2021 — 零售外汇 颁赠
-

World Finance 2021颁发
-

World Finance 2021颁发
-
FOLLOWME于2021年颁赠
-

Global Forex Awards 2021 — B2B 颁赠
-

Global Forex Awards颁赠
-

Global Forex Awards颁赠
-

CFI.co于2020年颁赠
-

CFI.co于2020年颁赠
-

荣获Global Business Awards 2020
-

World Finance Magazine 颁赠
World Finance Forex Awards 2020 -

World Finance Magazine 颁赠
World Finance Forex Awards 2020 -
FOLLOWME交易社区授予
-

Global Forex Awards颁赠
-

Global Forex Awards颁赠
-

FinTech Age Awards颁发
-

World Finance Magazine 颁赠
World Finance Forex Awards 2019 -

World Finance Magazine 颁赠
World Finance Forex Awards 2019 -

荣获 World Finance Forex Awards 2018 颁赠
-

荣获2018年埃及金融博览会颁赠
-

荣获 Shares Magazine 的 UK Forex Awards 2017 颁赠
-

荣获 World Finance Forex Awards 2017
-

2016年最佳黄金经纪商
-

2016年最佳外汇经纪商
-

2015年最佳本地客户服务
-

Global Brands Magazine 颁赠
-

Online Money Awards 2022 颁发
-

荣获2022年埃及金融博览会颁赠
-

2015最佳外汇交易平台
-

2015最佳金融交易平台
-

2013最佳创新外汇平台奖
-

2020年 Cyprus HR Awards 颁赠
-

金融行业的佼佼者
-

认证最优金牌级别
-

2014年首届亚军
-
Finance Magnates 颁发
-
Finance Magnates 颁发
-
Capital Finance International Magazine (CFI.co) 2024年颁赠
-
COLWMA 2024年颁赠
-
荣获World Finance Forex Awards 2023最佳外汇客户服务奖
-
荣获World Finance Forex Awards 2023欧洲最佳外汇经纪商奖
-
荣获World Finance Forex Awards 2023澳大拉西亚最佳外汇经纪商奖
-
荣获World Finance Forex Awards 2023拉丁美洲最佳外汇经纪商奖
-
荣获World Finance Forex Awards 2023中东最佳外汇经纪商奖
-
CFI.co于2023年颁赠
-
荣获2023年City of London Wealth Management Awards
-
荣获2022年埃及金融博览会颁赠
-
荣获2022年City of London Wealth Management Awards
-
CFI.co于2022年颁赠
-
荣获Global Forex Awards 2022 — 零售外汇 颁赠
-
2021年迪拜外汇博览会获颁赠
-
Ultimate Fintech 2021年颁赠
-
荣获2021年City of London Wealth Management Awards
-
FX168于2020年12月颁赠
-
荣获Global Business Awards 2020
-
荣获2020年City of London Wealth Management Awards
-
Capital Finance International Magazine (CFI.co)颁赠
-
Capital Finance International Magazine (CFI.co)颁赠
-
荣获2019年City of London Wealth Management Awards
-
Shares Magazine 授予 UK Forex Awards 2018
-
Capital Finance International Magazine (CFI.co)颁赠
-
Capital Finance International Magazine (CFI.co)颁赠
-
2017年伦敦财富管理奖
-
2016最佳本土 客户服务
-
中东和北非地区(MENA)增长最快的经纪商
-
2015年最佳外汇科技提供商
-
2014年最佳外汇科技提供商
-
2014年最佳外汇科技提供商
-
荣获 The Trading Show 2024年非洲 Africa Fintech 峰会颁赠
-
荣获2024年中东地区 Brokersview 颁赠
-
荣获2024年中东地区 Brokersview 颁赠
-
荣获2024年阿曼 Smart Vision 峰会颁赠
-
荣获2024年迪拜外汇博览会颁赠
-
荣获2024年迪拜 Forex Traders Summit 颁赠
-
2024年埃及 Smart Vision 峰会颁赠
-
投查查于2024年颁赠
-
Capital Finance International Magazine (CFI.co) 2024年颁赠
-
CFI.co于2023年颁赠
-
CFI.co于2023年颁赠
-
交易社区平台FOLLOWME于2022年颁赠
-
2022年迪拜Forex Expo获颁赠
-
2022年迪拜Forex Expo获颁赠
-
荣获Global Forex Awards 2022 — 零售外汇 颁赠
-
CFI.co于2022年颁赠
-
CFI.co于2022年颁赠
-
World Finance Forex Awards 2022 颁发
-
World Finance Forex Awards 2022 颁发
-
World Finance Forex Awards 2022 颁发
-
World Finance Forex Awards 2022 颁发
-
交易社区平台FOLLOWME于2021年颁赠
-
2021年埃及Smart Vision Investment Expo博览会获颁赠
-
CFI.co于2021年颁赠
-
CFI.co于2021年颁赠
-
荣获Global Forex Awards 2021 — 零售外汇 颁赠
-
荣获Global Forex Awards 2021 — 零售外汇 颁赠
-
World Finance 2021颁发
-
World Finance 2021颁发
-
FOLLOWME于2021年颁赠
-
Global Forex Awards 2021 — B2B 颁赠
-
Global Forex Awards颁赠
-
Global Forex Awards颁赠
-
CFI.co于2020年颁赠
-
CFI.co于2020年颁赠
-
荣获Global Business Awards 2020
-
World Finance Magazine 颁赠
World Finance Forex Awards 2020 -
World Finance Magazine 颁赠
World Finance Forex Awards 2020 -
FOLLOWME交易社区授予
-
Global Forex Awards颁赠
-
Global Forex Awards颁赠
-
FinTech Age Awards颁发
-
World Finance Magazine 颁赠
World Finance Forex Awards 2019 -
World Finance Magazine 颁赠
World Finance Forex Awards 2019 -
荣获 World Finance Forex Awards 2018 颁赠
-
荣获2018年埃及金融博览会颁赠
-
荣获 Shares Magazine 的 UK Forex Awards 2017 颁赠
-
荣获 World Finance Forex Awards 2017
-
2016年最佳黄金经纪商
-
2016年最佳外汇经纪商
-
2015年最佳本地客户服务
-
Global Brands Magazine 颁赠
-
Online Money Awards 2022 颁发
-
荣获2022年埃及金融博览会颁赠
-
2015最佳外汇交易平台
-
2015最佳金融交易平台
-
2013最佳创新外汇平台奖
-
2020年 Cyprus HR Awards 颁赠
-
金融行业的佼佼者
-
认证最优金牌级别
-
2014年首届亚军

Awarded BestBrokerYear After Year
CATEGORIES
market analysis
Gold continues to be bullish relying on the daily short-term moving average, looking at the power of CPI
Wonderful introduction:
Optimism is the line of egrets that go straight up to the sky, optimism is the thousands of white sails on the side of the sunken boat, optimism is the luxuriant grass blowing in the wind at the head of Parrot Island, optimism is the little bits of falling red that turn into spring mud to protect the flowers.
Hello everyone, today XM Forex will bring you "[XM Foreign Exchange Platform]: Gold continues to be bullish relying on the daily short-term moving average, looking at the power of CPI". Hope this helps you! The original content is as follows:
Zheng's Point of View: Gold continues to be bullish based on the daily short-term moving average, looking at the power of CPI
Reviewing yesterday's market trends and emerging technical points:
First, gold: Yesterday, the overall situation was still volatile, and it still relied on the daily short-term 5 moving average to consolidate at a strong high level. From the daily K, the trend is still OK, there is a certain pattern, but it is within a certain range during the day. Repeated strings within, every layout given, whether it is long or short, the ultimate goal is in place; although the direction is right, as long as the position is not stuck, it is still easy to be pierced and swept, or the position cannot be held; therefore, two aspects are still very important for the oscillating market, one is rhythm and the other is luck; Due to the upward trend, there is little chance of a washout. Basically, the support given is the rising point within the day, or may not be reached, and the resistance targets are all touched, many of which are breaking beyond expectations;
Today's market analysis and interpretation:
First, the gold daily level: relying on the 5-day moving average to close positive yesterday, but still not breaking through the key resistance level of 4350; today the 5-day moving average moved to the 4314 line, according to the shock bias Strong, there will be support above this position to pull up. Once it breaks through 4350, it will basically test towards the previous historical high of 4381, or even directly break through to see 4400; on the contrary, if it falls below the 5 moving average and continues downward, then the 10 moving average will line, which is also the lower rail support of the short-term upward channel. 4270-65 is a key and strong support, and touching it is a good low-level grasp; therefore, as long as the short-term 5th and 10th can continue to hold, 4350 will break through and stand sooner or later, orIt is said that sooner or later the bull market trend will break out again; then tonight’s CPI data will depend on whether it cooperates. If it is in line with expectations or lower than expected, then directly attack; if it is greater than expected, then it will fall first and then rise;

Second, the golden hourly level: The overall fluctuations in the white market today are not big, and the resistance and support predicted in the morning have not been tested; it was under pressure of 4350 for many times overnight and finally fell back, and it suppressed 4337 sideways this morning. This position can also be regarded as the 618 division resistance point at that time during the day. The price has been running in a narrow range around the middle rail, so there is no The operation value is too great, and the European market has fallen. At this time, it just tested the lower rail support of the yellow channel in the chart, which is also at the 66-day moving average at 4316. It is also close to the daily 5-day moving average. However, since the big data CPI is announced at 21:30, it is generally best to wait and see calmly before the announcement. No one can predict the outcome of the data. Entering rashly at this time is just a gamble. According to luck, from the channel distribution, pay attention to two key positions tonight, one is 4316-14, the other is the green convergence triangle lower track support 4293, the more extreme one is 4270-60, the previous low and the annual moving average, which is also the resonance of the daily 10 moving average; so this is inseparable from the data release. If the gold price is bullish, it is basically Look for a position above 4316-14 to see the bullish trend; if it is negative, wait until the declining low of 4270-60 stabilizes before looking to see the bullish trend. This position may be relatively low. As long as you dare to squat a little, there will be a lot of buying orders. If you seize a lower level to be bullish and hold the bottom position, there will be a large trend profit margin next year;

Silver: Yesterday, it closed in the sun. Today, it is still bullish and continues to sell short; the 5-day moving average supports the 64.4 line, the hourly line supports the 64.9-65 line on the 66th, and the top and bottom supports 64.6. These positions have support in the short term; as long as the development within the blue upward channel in the picture is maintained, the good upward momentum will still be maintained;
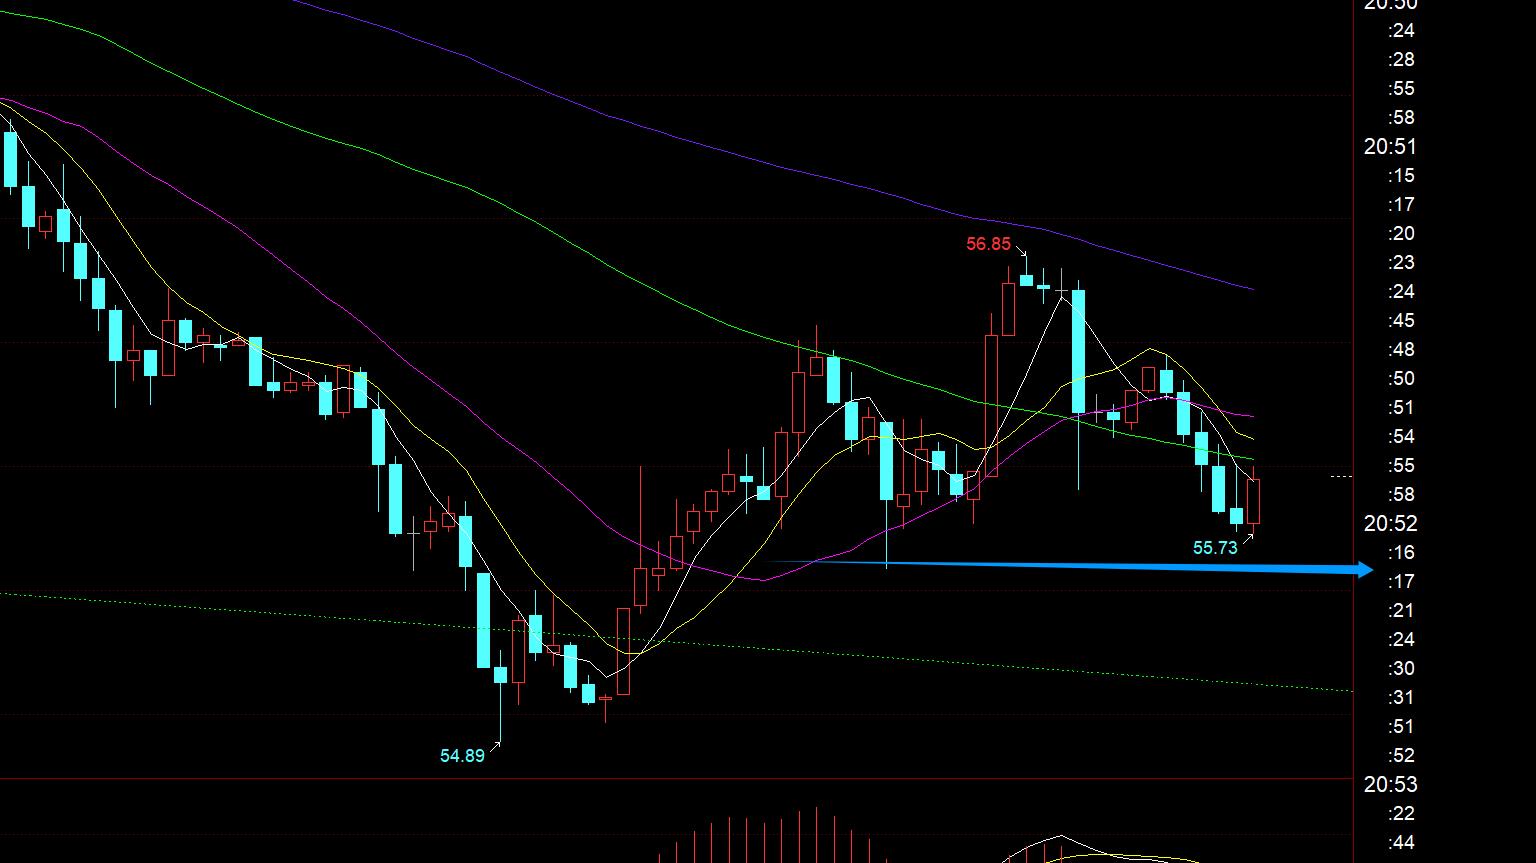
Crude oil: The lower rail support of 55.3 in the downward channel stabilized and rebounded. Originally, it continued to rise before yesterday's close. The daily line closed at full positive K. Today, the Asian market should have rebounded upward at least once, but it did not happen. Instead, it fluctuated and fell; so in the short term, it fell into a small range of shocks. Pay attention to 55 tonight. .8 The first-line support is the key. It can form a double bottom and pull up. Then there is hope to break through the intraday high and test the upper track of the channel; if it cannot be held, it may repeatedly test the lower track and then stabilize it again.
The above are several views of the author's technical analysis. As a reference, it is also the past 12 years of monitoring the market for more than 12 hours a day., summary of the technical experience accumulated in the review, technical points will be disclosed every day, and www.xmtraders.combined with text and video interpretation, friends who want to learn can www.xmtraders.compare and reference based on the actual trend; those who agree with the idea can refer to the operation, take good defense, and risk control first; those who do not agree, just let it pass; thank you for your support and attention;
[The views of the article are only for For reference, investment is risky. You need to be cautious when entering the market, operate rationally, set losses strictly, control positions, risk control first, and be responsible for profits and losses]
Writer: Zheng Shi Dian Yin
Read the market for more than 12 hours a day and study for ten years. Detailed technical interpretations are made public on the entire network, and we will serve with sincerity, dedication, sincerity, perseverance, and wholeheartedness to the end! Write www.xmtraders.comments on major financial websites! Proficient in K-line rules, channel rules, time rules, moving average rules, segmentation rules, and top-bottom rules; student cooperation registration hotline - WeChat: zdf289984986
The above content is about "[XM Foreign Exchange Platform]: Gold continues to be bullish based on daily short-term moving averages, look at the power of CPI". It is carefully www.xmtraders.compiled and edited by the editor of XM Foreign Exchange. I hope it will be helpful to your trading! Thanks for the support!
Every successful person has a beginning. Only by having the courage to start can you find the way to success. Read the next article now!
Disclaimers: XM Group only provides execution services and access permissions for online trading platforms, and allows individuals to view and/or use the website or the content provided on the website, but has no intention of making any changes or extensions, nor will it change or extend its services and access permissions. All access and usage permissions will be subject to the following terms and conditions: (i) Terms and conditions; (ii) Risk warning; And (iii) a complete disclaimer. Please note that all information provided on the website is for general informational purposes only. In addition, the content of all XM online trading platforms does not constitute, and cannot be used for any unauthorized financial market trading invitations and/or invitations. Financial market transactions pose significant risks to your investment capital.
All materials published on online trading platforms are only intended for educational/informational purposes and do not include or should be considered for financial, investment tax, or trading related consulting and advice, or transaction price records, or any financial product or non invitation related trading offers or invitations.
All content provided by XM and third-party suppliers on this website, including opinions, news, research, analysis, prices, other information, and third-party website links, remains unchanged and is provided as general market commentary rather than investment advice. All materials published on online trading platforms are only for educational/informational purposes and do not include or should be considered as applicable to financial, investment tax, or trading related advice and recommendations, or transaction price records, or any financial product or non invitation related financial offers or invitations. Please ensure that you have read and fully understood the information on XM's non independent investment research tips and risk warnings. For more details, please click here