


Trusted by over 15 Million Traders
The Most Awarded Broker
for a Reason
Easy Access to 1,400+ Global Assets
EURUSD
Euro vs U.S. Dollar
US500
S&P 500 (US500)
GOLD
Gold
COFFEE
US Coffee
Apple
Apple (AAPL.OQ)
-

Finance Magnates 颁发
-

Finance Magnates 颁发
-

Capital Finance International Magazine (CFI.co) 2024年颁赠
-

COLWMA 2024年颁赠
-

荣获World Finance Forex Awards 2023最佳外汇客户服务奖
-

荣获World Finance Forex Awards 2023欧洲最佳外汇经纪商奖
-

荣获World Finance Forex Awards 2023澳大拉西亚最佳外汇经纪商奖
-

荣获World Finance Forex Awards 2023拉丁美洲最佳外汇经纪商奖
-

荣获World Finance Forex Awards 2023中东最佳外汇经纪商奖
-

CFI.co于2023年颁赠
-

荣获2023年City of London Wealth Management Awards
-

荣获2022年埃及金融博览会颁赠
-

荣获2022年City of London Wealth Management Awards
-

CFI.co于2022年颁赠
-

荣获Global Forex Awards 2022 — 零售外汇 颁赠
-
2021年迪拜外汇博览会获颁赠
-

Ultimate Fintech 2021年颁赠
-

荣获2021年City of London Wealth Management Awards
-

FX168于2020年12月颁赠
-

荣获Global Business Awards 2020
-

荣获2020年City of London Wealth Management Awards
-

Capital Finance International Magazine (CFI.co)颁赠
-

Capital Finance International Magazine (CFI.co)颁赠
-

荣获2019年City of London Wealth Management Awards
-

Shares Magazine 授予 UK Forex Awards 2018
-

Capital Finance International Magazine (CFI.co)颁赠
-

Capital Finance International Magazine (CFI.co)颁赠
-

2017年伦敦财富管理奖
-

2016最佳本土 客户服务
-

中东和北非地区(MENA)增长最快的经纪商
-
2015年最佳外汇科技提供商
-
2014年最佳外汇科技提供商
-

2014年最佳外汇科技提供商
-

荣获 The Trading Show 2024年非洲 Africa Fintech 峰会颁赠
-

荣获2024年中东地区 Brokersview 颁赠
-
荣获2024年中东地区 Brokersview 颁赠
-

荣获2024年阿曼 Smart Vision 峰会颁赠
-

荣获2024年迪拜外汇博览会颁赠
-

荣获2024年迪拜 Forex Traders Summit 颁赠
-

2024年埃及 Smart Vision 峰会颁赠
-

投查查于2024年颁赠
-

Capital Finance International Magazine (CFI.co) 2024年颁赠
-

CFI.co于2023年颁赠
-

CFI.co于2023年颁赠
-

交易社区平台FOLLOWME于2022年颁赠
-
2022年迪拜Forex Expo获颁赠
-
2022年迪拜Forex Expo获颁赠
-

荣获Global Forex Awards 2022 — 零售外汇 颁赠
-

CFI.co于2022年颁赠
-

CFI.co于2022年颁赠
-

World Finance Forex Awards 2022 颁发
-

World Finance Forex Awards 2022 颁发
-

World Finance Forex Awards 2022 颁发
-

World Finance Forex Awards 2022 颁发
-
交易社区平台FOLLOWME于2021年颁赠
-

2021年埃及Smart Vision Investment Expo博览会获颁赠
-

CFI.co于2021年颁赠
-

CFI.co于2021年颁赠
-

荣获Global Forex Awards 2021 — 零售外汇 颁赠
-

荣获Global Forex Awards 2021 — 零售外汇 颁赠
-

World Finance 2021颁发
-

World Finance 2021颁发
-
FOLLOWME于2021年颁赠
-

Global Forex Awards 2021 — B2B 颁赠
-

Global Forex Awards颁赠
-

Global Forex Awards颁赠
-

CFI.co于2020年颁赠
-

CFI.co于2020年颁赠
-

荣获Global Business Awards 2020
-

World Finance Magazine 颁赠
World Finance Forex Awards 2020 -

World Finance Magazine 颁赠
World Finance Forex Awards 2020 -
FOLLOWME交易社区授予
-

Global Forex Awards颁赠
-

Global Forex Awards颁赠
-

FinTech Age Awards颁发
-

World Finance Magazine 颁赠
World Finance Forex Awards 2019 -

World Finance Magazine 颁赠
World Finance Forex Awards 2019 -

荣获 World Finance Forex Awards 2018 颁赠
-

荣获2018年埃及金融博览会颁赠
-

荣获 Shares Magazine 的 UK Forex Awards 2017 颁赠
-

荣获 World Finance Forex Awards 2017
-

2016年最佳黄金经纪商
-

2016年最佳外汇经纪商
-

2015年最佳本地客户服务
-

Global Brands Magazine 颁赠
-

Online Money Awards 2022 颁发
-

荣获2022年埃及金融博览会颁赠
-

2015最佳外汇交易平台
-

2015最佳金融交易平台
-

2013最佳创新外汇平台奖
-

2020年 Cyprus HR Awards 颁赠
-

金融行业的佼佼者
-

认证最优金牌级别
-

2014年首届亚军
-
Finance Magnates 颁发
-
Finance Magnates 颁发
-
Capital Finance International Magazine (CFI.co) 2024年颁赠
-
COLWMA 2024年颁赠
-
荣获World Finance Forex Awards 2023最佳外汇客户服务奖
-
荣获World Finance Forex Awards 2023欧洲最佳外汇经纪商奖
-
荣获World Finance Forex Awards 2023澳大拉西亚最佳外汇经纪商奖
-
荣获World Finance Forex Awards 2023拉丁美洲最佳外汇经纪商奖
-
荣获World Finance Forex Awards 2023中东最佳外汇经纪商奖
-
CFI.co于2023年颁赠
-
荣获2023年City of London Wealth Management Awards
-
荣获2022年埃及金融博览会颁赠
-
荣获2022年City of London Wealth Management Awards
-
CFI.co于2022年颁赠
-
荣获Global Forex Awards 2022 — 零售外汇 颁赠
-
2021年迪拜外汇博览会获颁赠
-
Ultimate Fintech 2021年颁赠
-
荣获2021年City of London Wealth Management Awards
-
FX168于2020年12月颁赠
-
荣获Global Business Awards 2020
-
荣获2020年City of London Wealth Management Awards
-
Capital Finance International Magazine (CFI.co)颁赠
-
Capital Finance International Magazine (CFI.co)颁赠
-
荣获2019年City of London Wealth Management Awards
-
Shares Magazine 授予 UK Forex Awards 2018
-
Capital Finance International Magazine (CFI.co)颁赠
-
Capital Finance International Magazine (CFI.co)颁赠
-
2017年伦敦财富管理奖
-
2016最佳本土 客户服务
-
中东和北非地区(MENA)增长最快的经纪商
-
2015年最佳外汇科技提供商
-
2014年最佳外汇科技提供商
-
2014年最佳外汇科技提供商
-
荣获 The Trading Show 2024年非洲 Africa Fintech 峰会颁赠
-
荣获2024年中东地区 Brokersview 颁赠
-
荣获2024年中东地区 Brokersview 颁赠
-
荣获2024年阿曼 Smart Vision 峰会颁赠
-
荣获2024年迪拜外汇博览会颁赠
-
荣获2024年迪拜 Forex Traders Summit 颁赠
-
2024年埃及 Smart Vision 峰会颁赠
-
投查查于2024年颁赠
-
Capital Finance International Magazine (CFI.co) 2024年颁赠
-
CFI.co于2023年颁赠
-
CFI.co于2023年颁赠
-
交易社区平台FOLLOWME于2022年颁赠
-
2022年迪拜Forex Expo获颁赠
-
2022年迪拜Forex Expo获颁赠
-
荣获Global Forex Awards 2022 — 零售外汇 颁赠
-
CFI.co于2022年颁赠
-
CFI.co于2022年颁赠
-
World Finance Forex Awards 2022 颁发
-
World Finance Forex Awards 2022 颁发
-
World Finance Forex Awards 2022 颁发
-
World Finance Forex Awards 2022 颁发
-
交易社区平台FOLLOWME于2021年颁赠
-
2021年埃及Smart Vision Investment Expo博览会获颁赠
-
CFI.co于2021年颁赠
-
CFI.co于2021年颁赠
-
荣获Global Forex Awards 2021 — 零售外汇 颁赠
-
荣获Global Forex Awards 2021 — 零售外汇 颁赠
-
World Finance 2021颁发
-
World Finance 2021颁发
-
FOLLOWME于2021年颁赠
-
Global Forex Awards 2021 — B2B 颁赠
-
Global Forex Awards颁赠
-
Global Forex Awards颁赠
-
CFI.co于2020年颁赠
-
CFI.co于2020年颁赠
-
荣获Global Business Awards 2020
-
World Finance Magazine 颁赠
World Finance Forex Awards 2020 -
World Finance Magazine 颁赠
World Finance Forex Awards 2020 -
FOLLOWME交易社区授予
-
Global Forex Awards颁赠
-
Global Forex Awards颁赠
-
FinTech Age Awards颁发
-
World Finance Magazine 颁赠
World Finance Forex Awards 2019 -
World Finance Magazine 颁赠
World Finance Forex Awards 2019 -
荣获 World Finance Forex Awards 2018 颁赠
-
荣获2018年埃及金融博览会颁赠
-
荣获 Shares Magazine 的 UK Forex Awards 2017 颁赠
-
荣获 World Finance Forex Awards 2017
-
2016年最佳黄金经纪商
-
2016年最佳外汇经纪商
-
2015年最佳本地客户服务
-
Global Brands Magazine 颁赠
-
Online Money Awards 2022 颁发
-
荣获2022年埃及金融博览会颁赠
-
2015最佳外汇交易平台
-
2015最佳金融交易平台
-
2013最佳创新外汇平台奖
-
2020年 Cyprus HR Awards 颁赠
-
金融行业的佼佼者
-
认证最优金牌级别
-
2014年首届亚军

Awarded BestBrokerYear After Year
CATEGORIES
News
- 【XM Forex】--USD/TRY Forecast: Rises on Lira Weakness and Inflation Strategy
- 【XM Forex】--Weekly Forex Forecast – EUR/USD, USD/CAD, Gold, Coffee, Corn
- 【XM Market Analysis】--BTC/USD Forex Signal: Bitcoin Surges, But Bearish Divergen
- 【XM Decision Analysis】--USD/MYR Analysis: Slight Move Lower in Thinly Traded Hol
- 【XM Forex】--USD/CHF Forecast: Threatens a Breakout
market analysis
Gold pays attention to the high gains and losses before, and then lays out after short-term adjustments in Europe and the United States
Wonderful Introduction:
Only by setting off can you reach your ideals and destinations, only by working hard can you achieve brilliant success, and only by sowing can you gain. Only by pursuing can one taste a dignified person.
Hello everyone, today XM Foreign Exchange will bring you "[XM Foreign Exchange]: Gold focuses on the high gains and losses before, and then layout after short-term adjustment in Europe and the United States." Hope it will be helpful to you! The original content is as follows:
Dollar Index
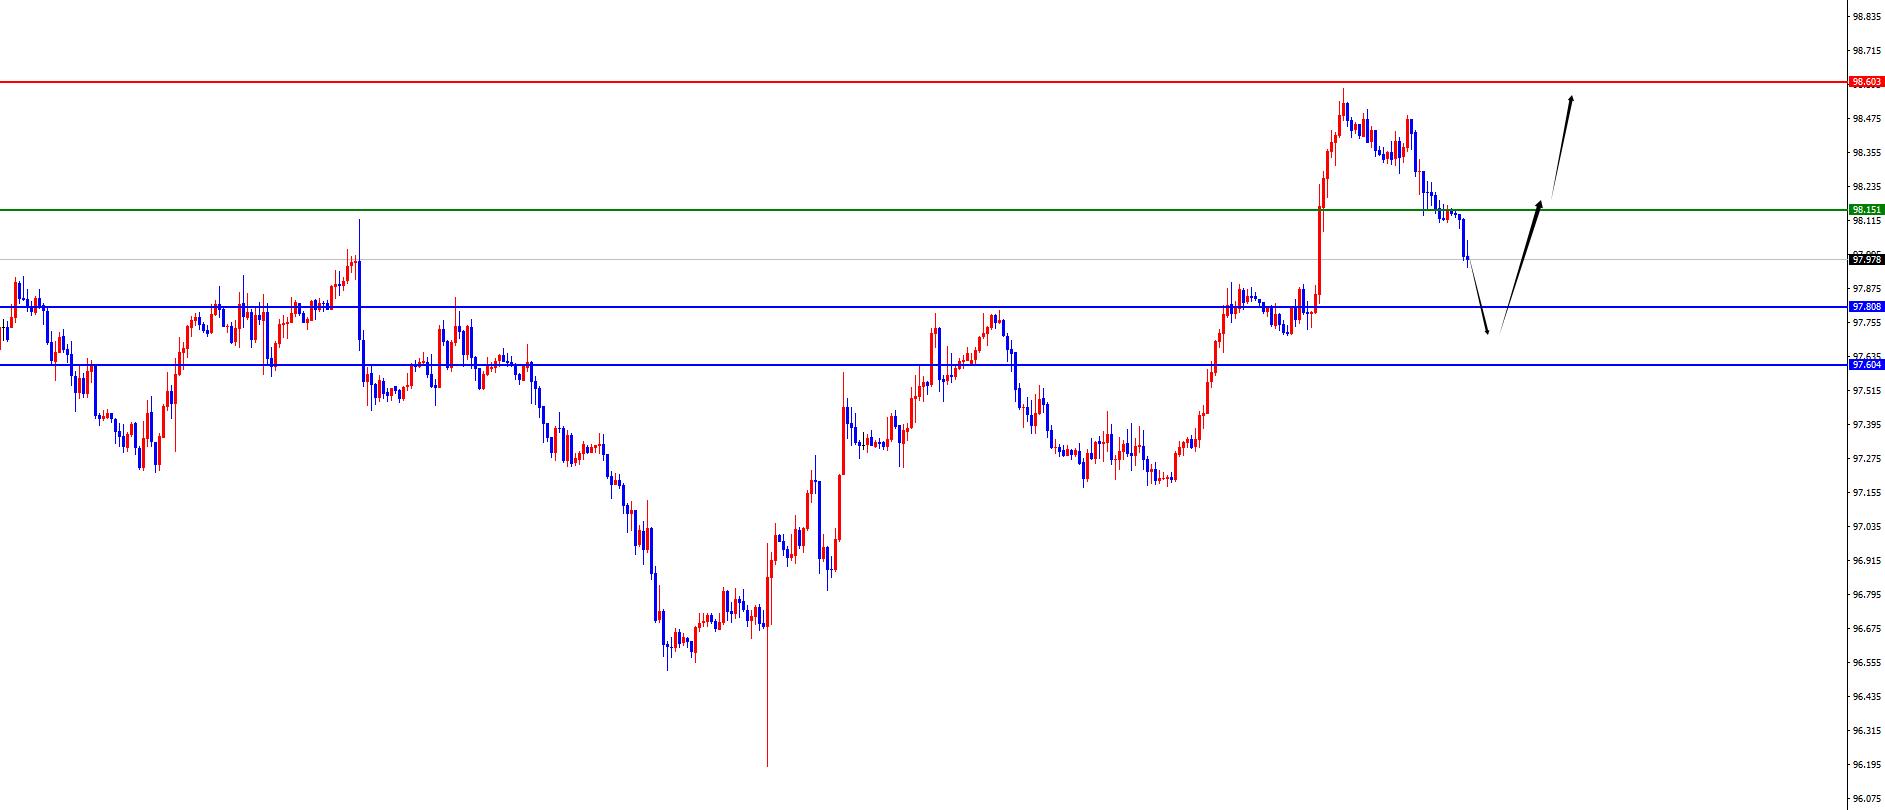
In terms of the performance of the US dollar index, the US dollar index showed a downward trend on Friday. The price of the US dollar index rose to 98.506 on the day, and fell to 98.108 on the lowest, and finally closed at 98.153. Looking back on the market performance last Friday, the price fluctuated in the short term during the early trading session, and then the price continued to fall, and the low point on the day was tested to the four-hour support position. Finally, the daily line ended with a big negative end, but the overall weekly line was positive and stood on the key resistance. This week, many Fed officials' speeches and non-agricultural data, and the subsequent focus was on the daily support and weekly support gains and losses.
From a multi-cycle analysis, the price has been consolidating in the weekly level recently. Currently, the weekly line supports the 97.80 area, and the price has been in the last week's resistance, and the bulls continue in the medium term. From the daily level, as time goes by, the daily line is currently supported in the 97.60 area, and the band above this position of the price has further risen. From the four-hour perspective, the current four-hour support is at the 98.15 resistance. The price is under pressure at this position. Then, when the daily and weekly support ranges appear, the bulls will continue to continue. If the price stabilizes again, the four-hour resistance will continue to look at the continuation.
The US dollar index has a long range of 97.60-70, with a defense of 5 US dollars, and a target of 98.10-98.50
Gold
In terms of gold, the price of gold generally showed an upward trend last Friday, with the highest price rising to 3783.64 on the day, and the lowest fell to 3734.33, closing at 3761.09Set. In response to the intraday price of gold last Friday, the price of gold was suppressed by four-hour resistance. After that, the US market price broke through and a second retracement gave the shorts the opportunity to leave the market and have more backhands. After that, the price was once again close to the previous historical high. This Sunday's support has become an important watershed.
From a multi-cycle analysis, first observe the monthly rhythm. The monthly price ended in August. Overall, the price is still running bullishly. From the long-term perspective, the 3000 position is the watershed of the long-term trend. The price can be treated more on the long-term. From the weekly level, the price is above the weekly support. Currently, the weekly long and short watershed is at 3480. The price is above this position and the medium line can be treated more. From the daily level, you need to pay attention to the support of 3700 regions. The band above this position is treated more often, and only after breaking down will there be pressure. The trading method on the right is temporarily treated. From the four-hour perspective, the price rose again after breaking through the four-hour resistance last Friday, but the price still did not break the 3700-3791 range. At the same time, the current four-hour support is in the 3750-3751 range. This position is the middle watershed for short-term oscillation, so the price is temporarily focused on the previous high gains and losses on the four-hour support. Once the breakthrough is made, it will be followed by the subsequent continuation. Then, the lower edge will be tested. At present, the bulls on the right are focused on the intensity issue.
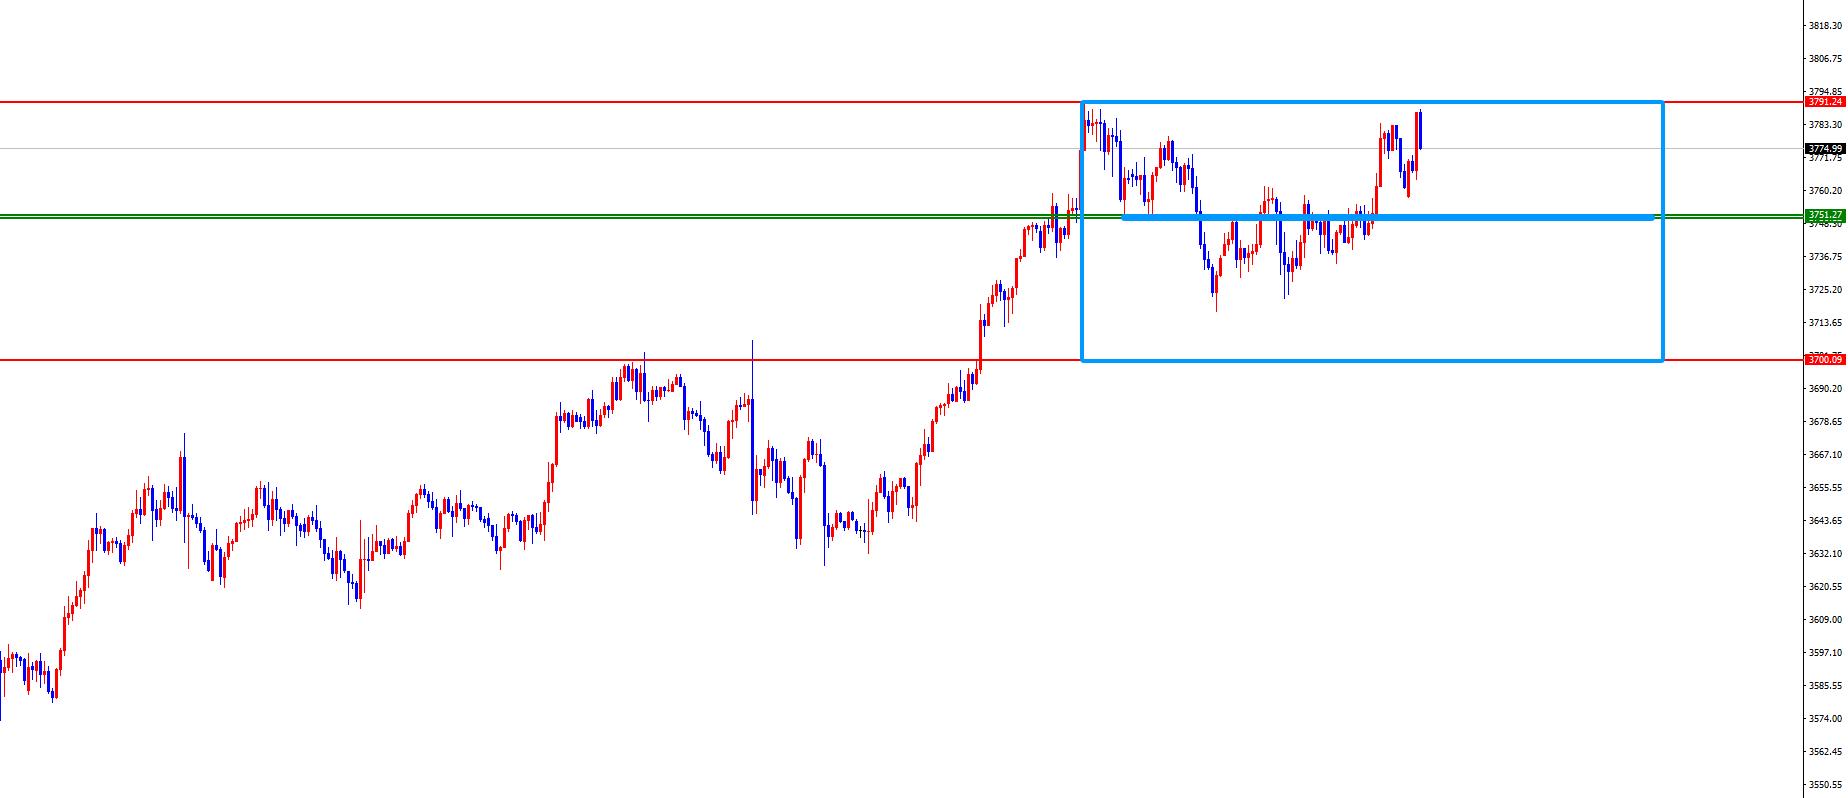
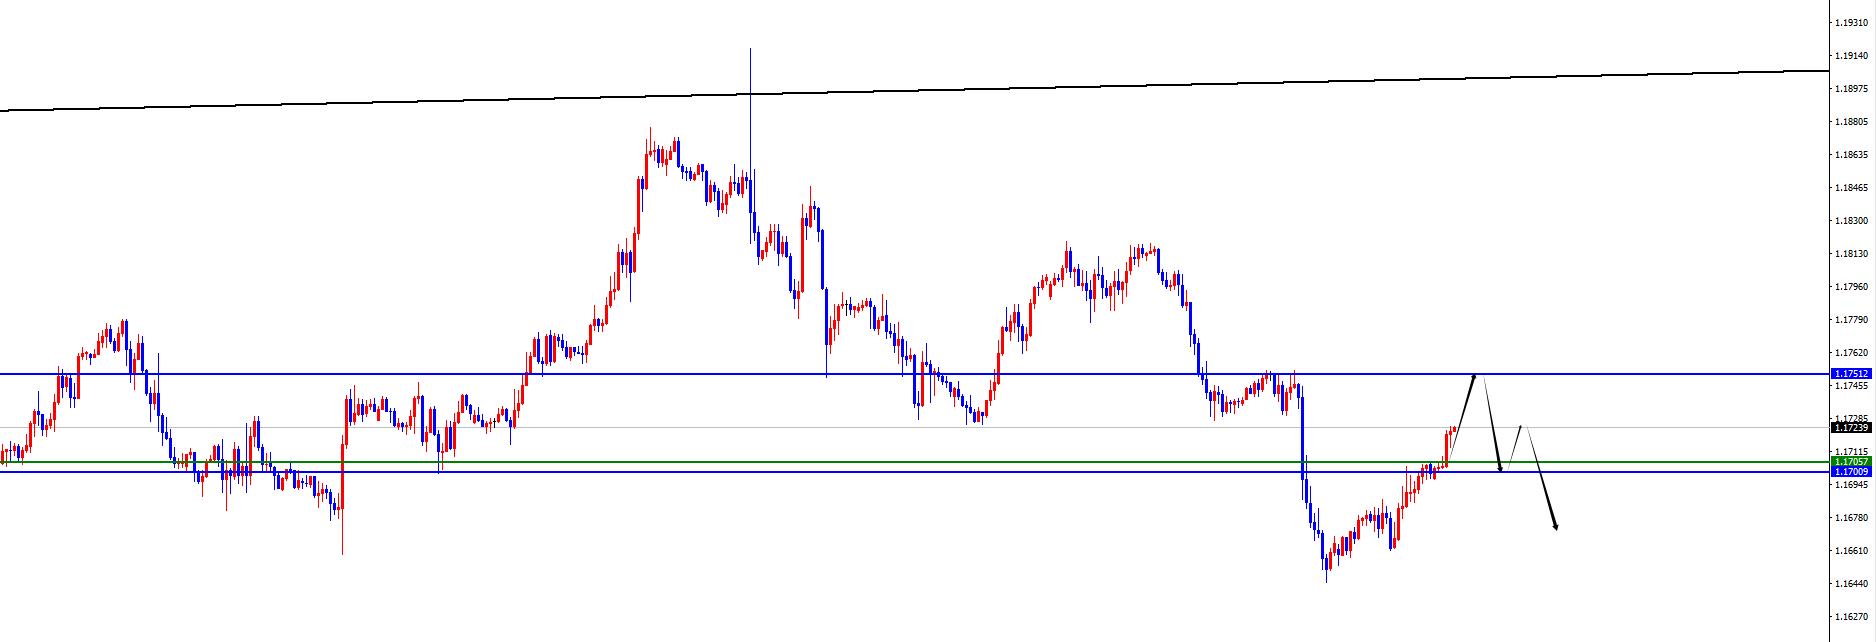
Gold focuses on the 3700-3791 range, and the price is above the 3750-3751 range. First look at the bulls. In terms of Europe and the United States, prices in Europe and the United States were generally rising last Friday. The price fell to 1.1653 on the day and rose to 1.1706 on the highest, closing at 1.1701 on the market. Looking back at the performance of European and American markets last Friday, the price gained support in the early morning session and rebounded upwardly, and then went from the overnight price test to the four-hour resistance position. At the same time, the early morning session is again making efforts. In the short term, we will first pay attention to market adjustments and then pay attention to the daily resistance pressure performance.
From a multi-cycle analysis, from the monthly level, Europe and the United States are supported by 1.1060, so the price is treated with long-term bulls above this position. From the weekly level, the price is supported by the 1.1700 area. This position is the long-shoulder watershed in the mid-line trend. This week, the key is to focus on whether the weekly closing can close below this position. From the daily level, the price fell below the daily support last week, and the previous support became a key resistance. Today, Monday is focused on the 1.1750 area, which is the key to the band trend. From the four-hour level, the price tested four-hour resistance last Friday, and today's price broke through and rose again, so the short-term adjustment will continue, so don't chase short for the time being, wait until the daily resistance is tested before paying attention to the pressure. The current four-hour watershed is at 1.1720. From the one-hour perspective, the current adjustment is still continuing, so do not chase short for the time being. Wait for the adjustment to the daily resistance before looking at the pressure, and then fall below the four small points after the declineWhen the support will accelerate again.
Europe and the United States have a short range of 1.1750-60, defense is 40 points, target 1.1700-1.1650
[Finance data and events that are focused today] Monday, September 29, 2025
①16:30 UK Central Bank Mortgage License in August
②17:00 Eurozone September Industrial Prosperity Index
③17:00 Eurozone September Economic Prosperity Index
④20:00 Federal Reserve Hamak participated in the group discussion
⑤22:00 US Home Signing Sales Index Monthly Rate
⑥22:30 US Dallas Fed Business Activity Index
⑦ 01:30 the next day, Federal Reserve Williams delivered a speech
⑧The next day, 01:30 the Fed Mousalem delivered a speech
⑨The next day, 06:00 the next day, Federal Reserve Bostic held a dialogue
Note: The above is only personal opinions and strategies, for reference and www.xmtraders.communication only, and does not give customers any investment advice. It has nothing to do with customers' investment, and is not used as a basis for placing an order.
The above content is all about "[XM Forex]: Gold focuses on the high gains and losses before, and then layout after short-term adjustment in Europe and the United States". It is carefully www.xmtraders.compiled and edited by the editor of XM Forex. I hope it will be helpful to your trading! Thanks for the support!
After doing something, there will always be experience and lessons. In order to facilitate future work, we must analyze, study, summarize and concentrate the experience and lessons of previous work, and raise it to the theoretical level to understand it.
Disclaimers: XM Group only provides execution services and access permissions for online trading platforms, and allows individuals to view and/or use the website or the content provided on the website, but has no intention of making any changes or extensions, nor will it change or extend its services and access permissions. All access and usage permissions will be subject to the following terms and conditions: (i) Terms and conditions; (ii) Risk warning; And (iii) a complete disclaimer. Please note that all information provided on the website is for general informational purposes only. In addition, the content of all XM online trading platforms does not constitute, and cannot be used for any unauthorized financial market trading invitations and/or invitations. Financial market transactions pose significant risks to your investment capital.
All materials published on online trading platforms are only intended for educational/informational purposes and do not include or should be considered for financial, investment tax, or trading related consulting and advice, or transaction price records, or any financial product or non invitation related trading offers or invitations.
All content provided by XM and third-party suppliers on this website, including opinions, news, research, analysis, prices, other information, and third-party website links, remains unchanged and is provided as general market commentary rather than investment advice. All materials published on online trading platforms are only for educational/informational purposes and do not include or should be considered as applicable to financial, investment tax, or trading related advice and recommendations, or transaction price records, or any financial product or non invitation related financial offers or invitations. Please ensure that you have read and fully understood the information on XM's non independent investment research tips and risk warnings. For more details, please click here