


Trusted by over 15 Million Traders
The Most Awarded Broker
for a Reason
Easy Access to 1,400+ Global Assets
EURUSD
Euro vs U.S. Dollar
US500
S&P 500 (US500)
GOLD
Gold
COFFEE
US Coffee
Apple
Apple (AAPL.OQ)
-

Finance Magnates 颁发
-

Finance Magnates 颁发
-

Capital Finance International Magazine (CFI.co) 2024年颁赠
-

COLWMA 2024年颁赠
-

荣获World Finance Forex Awards 2023最佳外汇客户服务奖
-

荣获World Finance Forex Awards 2023欧洲最佳外汇经纪商奖
-

荣获World Finance Forex Awards 2023澳大拉西亚最佳外汇经纪商奖
-

荣获World Finance Forex Awards 2023拉丁美洲最佳外汇经纪商奖
-

荣获World Finance Forex Awards 2023中东最佳外汇经纪商奖
-

CFI.co于2023年颁赠
-

荣获2023年City of London Wealth Management Awards
-

荣获2022年埃及金融博览会颁赠
-

荣获2022年City of London Wealth Management Awards
-

CFI.co于2022年颁赠
-

荣获Global Forex Awards 2022 — 零售外汇 颁赠
-
2021年迪拜外汇博览会获颁赠
-

Ultimate Fintech 2021年颁赠
-

荣获2021年City of London Wealth Management Awards
-

FX168于2020年12月颁赠
-

荣获Global Business Awards 2020
-

荣获2020年City of London Wealth Management Awards
-

Capital Finance International Magazine (CFI.co)颁赠
-

Capital Finance International Magazine (CFI.co)颁赠
-

荣获2019年City of London Wealth Management Awards
-

Shares Magazine 授予 UK Forex Awards 2018
-

Capital Finance International Magazine (CFI.co)颁赠
-

Capital Finance International Magazine (CFI.co)颁赠
-

2017年伦敦财富管理奖
-

2016最佳本土 客户服务
-

中东和北非地区(MENA)增长最快的经纪商
-
2015年最佳外汇科技提供商
-
2014年最佳外汇科技提供商
-

2014年最佳外汇科技提供商
-

荣获 The Trading Show 2024年非洲 Africa Fintech 峰会颁赠
-

荣获2024年中东地区 Brokersview 颁赠
-
荣获2024年中东地区 Brokersview 颁赠
-

荣获2024年阿曼 Smart Vision 峰会颁赠
-

荣获2024年迪拜外汇博览会颁赠
-

荣获2024年迪拜 Forex Traders Summit 颁赠
-

2024年埃及 Smart Vision 峰会颁赠
-

投查查于2024年颁赠
-

Capital Finance International Magazine (CFI.co) 2024年颁赠
-

CFI.co于2023年颁赠
-

CFI.co于2023年颁赠
-

交易社区平台FOLLOWME于2022年颁赠
-
2022年迪拜Forex Expo获颁赠
-
2022年迪拜Forex Expo获颁赠
-

荣获Global Forex Awards 2022 — 零售外汇 颁赠
-

CFI.co于2022年颁赠
-

CFI.co于2022年颁赠
-

World Finance Forex Awards 2022 颁发
-

World Finance Forex Awards 2022 颁发
-

World Finance Forex Awards 2022 颁发
-

World Finance Forex Awards 2022 颁发
-
交易社区平台FOLLOWME于2021年颁赠
-

2021年埃及Smart Vision Investment Expo博览会获颁赠
-

CFI.co于2021年颁赠
-

CFI.co于2021年颁赠
-

荣获Global Forex Awards 2021 — 零售外汇 颁赠
-

荣获Global Forex Awards 2021 — 零售外汇 颁赠
-

World Finance 2021颁发
-

World Finance 2021颁发
-
FOLLOWME于2021年颁赠
-

Global Forex Awards 2021 — B2B 颁赠
-

Global Forex Awards颁赠
-

Global Forex Awards颁赠
-

CFI.co于2020年颁赠
-

CFI.co于2020年颁赠
-

荣获Global Business Awards 2020
-

World Finance Magazine 颁赠
World Finance Forex Awards 2020 -

World Finance Magazine 颁赠
World Finance Forex Awards 2020 -
FOLLOWME交易社区授予
-

Global Forex Awards颁赠
-

Global Forex Awards颁赠
-

FinTech Age Awards颁发
-

World Finance Magazine 颁赠
World Finance Forex Awards 2019 -

World Finance Magazine 颁赠
World Finance Forex Awards 2019 -

荣获 World Finance Forex Awards 2018 颁赠
-

荣获2018年埃及金融博览会颁赠
-

荣获 Shares Magazine 的 UK Forex Awards 2017 颁赠
-

荣获 World Finance Forex Awards 2017
-

2016年最佳黄金经纪商
-

2016年最佳外汇经纪商
-

2015年最佳本地客户服务
-

Global Brands Magazine 颁赠
-

Online Money Awards 2022 颁发
-

荣获2022年埃及金融博览会颁赠
-

2015最佳外汇交易平台
-

2015最佳金融交易平台
-

2013最佳创新外汇平台奖
-

2020年 Cyprus HR Awards 颁赠
-

金融行业的佼佼者
-

认证最优金牌级别
-

2014年首届亚军
-
Finance Magnates 颁发
-
Finance Magnates 颁发
-
Capital Finance International Magazine (CFI.co) 2024年颁赠
-
COLWMA 2024年颁赠
-
荣获World Finance Forex Awards 2023最佳外汇客户服务奖
-
荣获World Finance Forex Awards 2023欧洲最佳外汇经纪商奖
-
荣获World Finance Forex Awards 2023澳大拉西亚最佳外汇经纪商奖
-
荣获World Finance Forex Awards 2023拉丁美洲最佳外汇经纪商奖
-
荣获World Finance Forex Awards 2023中东最佳外汇经纪商奖
-
CFI.co于2023年颁赠
-
荣获2023年City of London Wealth Management Awards
-
荣获2022年埃及金融博览会颁赠
-
荣获2022年City of London Wealth Management Awards
-
CFI.co于2022年颁赠
-
荣获Global Forex Awards 2022 — 零售外汇 颁赠
-
2021年迪拜外汇博览会获颁赠
-
Ultimate Fintech 2021年颁赠
-
荣获2021年City of London Wealth Management Awards
-
FX168于2020年12月颁赠
-
荣获Global Business Awards 2020
-
荣获2020年City of London Wealth Management Awards
-
Capital Finance International Magazine (CFI.co)颁赠
-
Capital Finance International Magazine (CFI.co)颁赠
-
荣获2019年City of London Wealth Management Awards
-
Shares Magazine 授予 UK Forex Awards 2018
-
Capital Finance International Magazine (CFI.co)颁赠
-
Capital Finance International Magazine (CFI.co)颁赠
-
2017年伦敦财富管理奖
-
2016最佳本土 客户服务
-
中东和北非地区(MENA)增长最快的经纪商
-
2015年最佳外汇科技提供商
-
2014年最佳外汇科技提供商
-
2014年最佳外汇科技提供商
-
荣获 The Trading Show 2024年非洲 Africa Fintech 峰会颁赠
-
荣获2024年中东地区 Brokersview 颁赠
-
荣获2024年中东地区 Brokersview 颁赠
-
荣获2024年阿曼 Smart Vision 峰会颁赠
-
荣获2024年迪拜外汇博览会颁赠
-
荣获2024年迪拜 Forex Traders Summit 颁赠
-
2024年埃及 Smart Vision 峰会颁赠
-
投查查于2024年颁赠
-
Capital Finance International Magazine (CFI.co) 2024年颁赠
-
CFI.co于2023年颁赠
-
CFI.co于2023年颁赠
-
交易社区平台FOLLOWME于2022年颁赠
-
2022年迪拜Forex Expo获颁赠
-
2022年迪拜Forex Expo获颁赠
-
荣获Global Forex Awards 2022 — 零售外汇 颁赠
-
CFI.co于2022年颁赠
-
CFI.co于2022年颁赠
-
World Finance Forex Awards 2022 颁发
-
World Finance Forex Awards 2022 颁发
-
World Finance Forex Awards 2022 颁发
-
World Finance Forex Awards 2022 颁发
-
交易社区平台FOLLOWME于2021年颁赠
-
2021年埃及Smart Vision Investment Expo博览会获颁赠
-
CFI.co于2021年颁赠
-
CFI.co于2021年颁赠
-
荣获Global Forex Awards 2021 — 零售外汇 颁赠
-
荣获Global Forex Awards 2021 — 零售外汇 颁赠
-
World Finance 2021颁发
-
World Finance 2021颁发
-
FOLLOWME于2021年颁赠
-
Global Forex Awards 2021 — B2B 颁赠
-
Global Forex Awards颁赠
-
Global Forex Awards颁赠
-
CFI.co于2020年颁赠
-
CFI.co于2020年颁赠
-
荣获Global Business Awards 2020
-
World Finance Magazine 颁赠
World Finance Forex Awards 2020 -
World Finance Magazine 颁赠
World Finance Forex Awards 2020 -
FOLLOWME交易社区授予
-
Global Forex Awards颁赠
-
Global Forex Awards颁赠
-
FinTech Age Awards颁发
-
World Finance Magazine 颁赠
World Finance Forex Awards 2019 -
World Finance Magazine 颁赠
World Finance Forex Awards 2019 -
荣获 World Finance Forex Awards 2018 颁赠
-
荣获2018年埃及金融博览会颁赠
-
荣获 Shares Magazine 的 UK Forex Awards 2017 颁赠
-
荣获 World Finance Forex Awards 2017
-
2016年最佳黄金经纪商
-
2016年最佳外汇经纪商
-
2015年最佳本地客户服务
-
Global Brands Magazine 颁赠
-
Online Money Awards 2022 颁发
-
荣获2022年埃及金融博览会颁赠
-
2015最佳外汇交易平台
-
2015最佳金融交易平台
-
2013最佳创新外汇平台奖
-
2020年 Cyprus HR Awards 颁赠
-
金融行业的佼佼者
-
认证最优金牌级别
-
2014年首届亚军

Awarded BestBrokerYear After Year
CATEGORIES
News
- 【XM Forex】--USD/PKR Analysis: Trends Higher Amid Controlled Market
- 【XM Group】--USD/MXN Forecast: Dollar on the Verge of Smashing the Peso
- 【XM Group】--USD/INR: Relative Stability as More Potential Reactions Lurk
- 【XM Market Analysis】--USD/MXN Monthly Forecast: February 2025
- 【XM Market Review】--EUR/USD Forex Signal: Bears Testing $1.0500 Again
market analysis
Daily spindle makes pregnancy line, white clothes cross the river with more gold and silver
Wonderful Introduction:
If the sea loses the rolling waves, it will lose its majesty; if the desert loses the dancing of flying sand, it will lose its magnificence; if life loses its real journey, it will lose its meaning.
Hello everyone, today XM Foreign Exchange will bring you "[XM Foreign Exchange Official Website]: Daily spindle makes pregnancy lines, white clothes cross the river with more gold and silver". Hope it will be helpful to you! The original content is as follows:
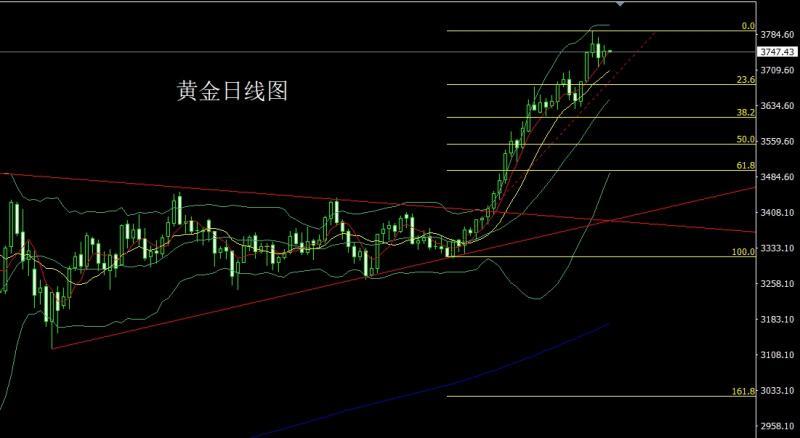
Yesterday, the gold market opened at the early stage of 3737 and then the market first rose, and then the market fell rapidly, and then the market rose strongly. The daily line reached the highest position of 3761.7 and then the market fell strongly during the start of the US session. The daily line was at the lowest position of 3721.6 and then the market rose at the end of the trading session. The daily line finally closed at the 3748.9 position and the market was in a strong position. A spindle pattern with equal length of upper and lower shadows closed, and after such a pattern ended, the long 3325 and 3322 below were long and 3377 and 3385 long and 3563 last week reduced positions and the stop loss followed at 3590. Today, 3728 long and 2725 long stop loss 3721, the target is 3758 and 3765 and 3772 and 3780-3785.
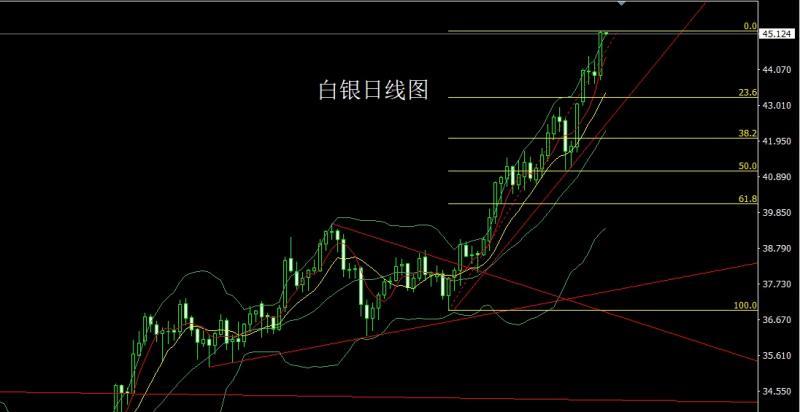
The silver market opened at 43.894 yesterday and the market fell first. The market rose strongly. The daily line reached the highest position of 45.221 and then the market consolidated. After the daily line finally closed at 45.174, the daily line closed with a saturated large positive line with a slightly shadow line. After the pattern of this line ended, the long 37.8 below and the long 38.8 below and the long 38.8 on Friday reduced positions and the stop loss followed up at 42. Today's 44.6 long stop loss is 44.35, and the target is 45.2 and 45.6 and 47.
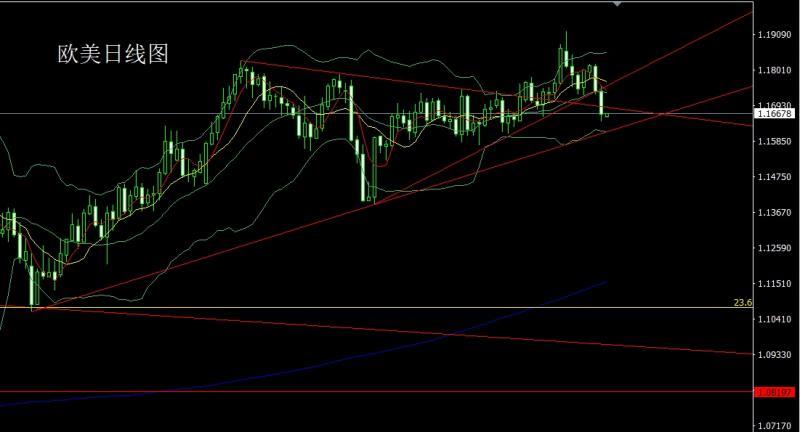
European and American markets opened at 1.17381 yesterday and the market first rose to give the daily high of 1.17537. The market fell strongly. The daily line was at the lowest point of 1.16443 and then consolidated. After the daily line finally closed at 1.16648, the daily line closed with a large negative line with an upper and lower shadow line. After this pattern ended, today's short stop loss of 1.17150 is 1.17350, and the target is 1.16500 and 1.16300 and 1.16000.
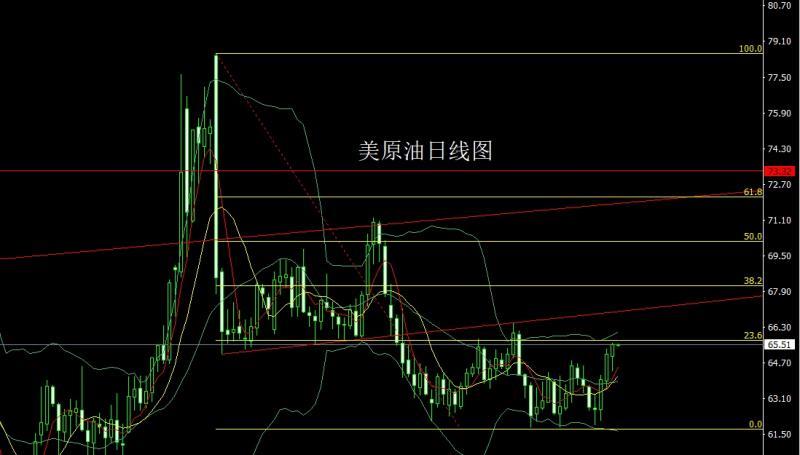
The U.S. crude oil market opened at 65 yesterday and the market fell first. The daily line was at the lowest point of 64.3 and then the market rose strongly. The daily line reached the highest point of 65.6 and then the market consolidated. After the daily line finally closed at 65.52, the daily line closed in a hammer head pattern with a long lower shadow line. After this pattern ended, the long 62.2 below and the long 64.4 below and the long 64.4 yesterday reduced positions and the stop loss followed at 64.4, and today's 64.9 long stop loss 64.4, the target is 65.6 and 66.2 and 66.6 and 67-67.5.
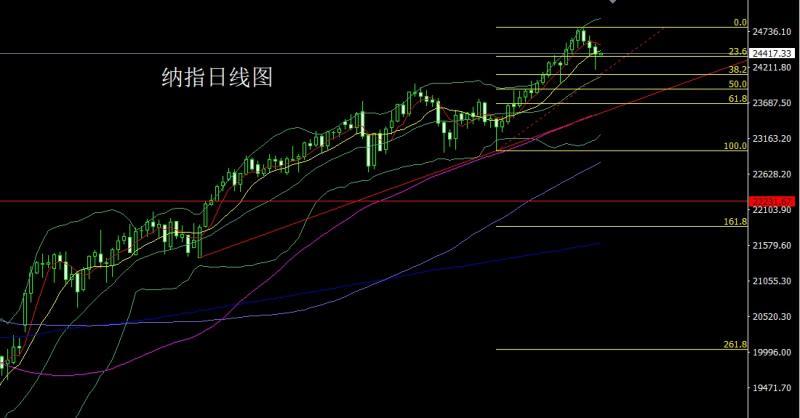
The Nasdaq market opened at 24507.37 yesterday and then rose first. The market first gave a position of 24552.66. Then the market fluctuated and fell. The daily line was at the lowest point of 24180.25 and then rose at the end of the trading session. The daily line finally closed at 24401.68. Then the market closed in a hammer head with a very long lower shadow line. After this pattern ended, the early trading first gave a short stop loss of 24500. The target below looked at 24400 and 24300-24250.
Fundamentals, yesterday's fundamentals The number of initial unemployment claims in the United States to September 20 recorded 218,000, the lowest since the week of July 19, 2025, and the previous value was revised from 231,000 to 232,000. The number of initial jobless claims released by the U.S. fell to its lowest level since mid-July, highlighting that businesses remain cautious about layoffs. Benefiting from consumer spending, the U.S. GDP growth rate in the second quarter hit the fastest record in nearly two years. Local Fed officials spoke continuously, and Logan called for reform of the interest rate benchmark to replace the federal funds rate with a more efficient three-party general interest rate (TGCR), because the former had a transaction size of about $1 trillion per day and the latter was $100 billion per day. She said this move was a technical adjustment and we should be prepared for danger and reform as soon as possible. Bowman said he should now turn to employment rather than inflation. Schmid said the more balance sheet shrinks, the better. Today's fundamentals are the key to this week, focusing on the beauty at 20:30The annual rate of the core PCE price index in August is expected to be 2.9% in this round. Look at the final value of the University of Michigan Consumer Confidence Index in September at 22:00 and the expected final value of the first-year inflation rate in September.
In terms of operation, gold: 3325 and 3322 long below and 3377 and 3385 long last week, and 3563 long last week, and the stop loss followed by holding at 3590. Today, 3728 long conservative 2725 long stop loss 3721, and the target is 3758 and 3765 and 3772 and 3780-3785.
Silver: 37.8 long below and 37.8 long last Friday, and the stop loss followed by holding at 42. Today's 44.6 long stop loss is 44.35, the target is 45.2 and 45.6 and 47.
Europe and the United States: Today's 1.17150 short stop loss is 1.17350, the target is 1.16500 and 1.16300 and 1.16000.
US crude oil: The long position of 62.2 below and the long position of 64.4 yesterday's 64.4, the target is 64.4, the target is 65.6 and 66.2 and 66.6 and 67-67.5.
Nasdaq: The first pull-up in the morning session gave 24500 short stop loss 24550, and the target is 24400 and 24300-24250 left the market and backhand long.
The above content is all about "[XM Forex Official Website]: Daily spindle makes pregnancy lines, white clothes cross the river with lots of gold and silver". It is carefully www.xmtraders.compiled and edited by the editor of XM Forex. I hope it will be helpful to your transactions! Thanks for the support!
After doing something, there will always be experience and lessons. In order to facilitate future work, we must analyze, study, summarize and concentrate the experience and lessons of previous work, and raise it to the theoretical level to understand it.
Disclaimers: XM Group only provides execution services and access permissions for online trading platforms, and allows individuals to view and/or use the website or the content provided on the website, but has no intention of making any changes or extensions, nor will it change or extend its services and access permissions. All access and usage permissions will be subject to the following terms and conditions: (i) Terms and conditions; (ii) Risk warning; And (iii) a complete disclaimer. Please note that all information provided on the website is for general informational purposes only. In addition, the content of all XM online trading platforms does not constitute, and cannot be used for any unauthorized financial market trading invitations and/or invitations. Financial market transactions pose significant risks to your investment capital.
All materials published on online trading platforms are only intended for educational/informational purposes and do not include or should be considered for financial, investment tax, or trading related consulting and advice, or transaction price records, or any financial product or non invitation related trading offers or invitations.
All content provided by XM and third-party suppliers on this website, including opinions, news, research, analysis, prices, other information, and third-party website links, remains unchanged and is provided as general market commentary rather than investment advice. All materials published on online trading platforms are only for educational/informational purposes and do not include or should be considered as applicable to financial, investment tax, or trading related advice and recommendations, or transaction price records, or any financial product or non invitation related financial offers or invitations. Please ensure that you have read and fully understood the information on XM's non independent investment research tips and risk warnings. For more details, please click here