


Trusted by over 15 Million Traders
The Most Awarded Broker
for a Reason
Easy Access to 1,400+ Global Assets
EURUSD
Euro vs U.S. Dollar
US500
S&P 500 (US500)
GOLD
Gold
COFFEE
US Coffee
Apple
Apple (AAPL.OQ)
-

Finance Magnates 颁发
-

Finance Magnates 颁发
-

Capital Finance International Magazine (CFI.co) 2024年颁赠
-

COLWMA 2024年颁赠
-

荣获World Finance Forex Awards 2023最佳外汇客户服务奖
-

荣获World Finance Forex Awards 2023欧洲最佳外汇经纪商奖
-

荣获World Finance Forex Awards 2023澳大拉西亚最佳外汇经纪商奖
-

荣获World Finance Forex Awards 2023拉丁美洲最佳外汇经纪商奖
-

荣获World Finance Forex Awards 2023中东最佳外汇经纪商奖
-

CFI.co于2023年颁赠
-

荣获2023年City of London Wealth Management Awards
-

荣获2022年埃及金融博览会颁赠
-

荣获2022年City of London Wealth Management Awards
-

CFI.co于2022年颁赠
-

荣获Global Forex Awards 2022 — 零售外汇 颁赠
-
2021年迪拜外汇博览会获颁赠
-

Ultimate Fintech 2021年颁赠
-

荣获2021年City of London Wealth Management Awards
-

FX168于2020年12月颁赠
-

荣获Global Business Awards 2020
-

荣获2020年City of London Wealth Management Awards
-

Capital Finance International Magazine (CFI.co)颁赠
-

Capital Finance International Magazine (CFI.co)颁赠
-

荣获2019年City of London Wealth Management Awards
-

Shares Magazine 授予 UK Forex Awards 2018
-

Capital Finance International Magazine (CFI.co)颁赠
-

Capital Finance International Magazine (CFI.co)颁赠
-

2017年伦敦财富管理奖
-

2016最佳本土 客户服务
-

中东和北非地区(MENA)增长最快的经纪商
-
2015年最佳外汇科技提供商
-
2014年最佳外汇科技提供商
-

2014年最佳外汇科技提供商
-

荣获 The Trading Show 2024年非洲 Africa Fintech 峰会颁赠
-

荣获2024年中东地区 Brokersview 颁赠
-
荣获2024年中东地区 Brokersview 颁赠
-

荣获2024年阿曼 Smart Vision 峰会颁赠
-

荣获2024年迪拜外汇博览会颁赠
-

荣获2024年迪拜 Forex Traders Summit 颁赠
-

2024年埃及 Smart Vision 峰会颁赠
-

投查查于2024年颁赠
-

Capital Finance International Magazine (CFI.co) 2024年颁赠
-

CFI.co于2023年颁赠
-

CFI.co于2023年颁赠
-

交易社区平台FOLLOWME于2022年颁赠
-
2022年迪拜Forex Expo获颁赠
-
2022年迪拜Forex Expo获颁赠
-

荣获Global Forex Awards 2022 — 零售外汇 颁赠
-

CFI.co于2022年颁赠
-

CFI.co于2022年颁赠
-

World Finance Forex Awards 2022 颁发
-

World Finance Forex Awards 2022 颁发
-

World Finance Forex Awards 2022 颁发
-

World Finance Forex Awards 2022 颁发
-
交易社区平台FOLLOWME于2021年颁赠
-

2021年埃及Smart Vision Investment Expo博览会获颁赠
-

CFI.co于2021年颁赠
-

CFI.co于2021年颁赠
-

荣获Global Forex Awards 2021 — 零售外汇 颁赠
-

荣获Global Forex Awards 2021 — 零售外汇 颁赠
-

World Finance 2021颁发
-

World Finance 2021颁发
-
FOLLOWME于2021年颁赠
-

Global Forex Awards 2021 — B2B 颁赠
-

Global Forex Awards颁赠
-

Global Forex Awards颁赠
-

CFI.co于2020年颁赠
-

CFI.co于2020年颁赠
-

荣获Global Business Awards 2020
-

World Finance Magazine 颁赠
World Finance Forex Awards 2020 -

World Finance Magazine 颁赠
World Finance Forex Awards 2020 -
FOLLOWME交易社区授予
-

Global Forex Awards颁赠
-

Global Forex Awards颁赠
-

FinTech Age Awards颁发
-

World Finance Magazine 颁赠
World Finance Forex Awards 2019 -

World Finance Magazine 颁赠
World Finance Forex Awards 2019 -

荣获 World Finance Forex Awards 2018 颁赠
-

荣获2018年埃及金融博览会颁赠
-

荣获 Shares Magazine 的 UK Forex Awards 2017 颁赠
-

荣获 World Finance Forex Awards 2017
-

2016年最佳黄金经纪商
-

2016年最佳外汇经纪商
-

2015年最佳本地客户服务
-

Global Brands Magazine 颁赠
-

Online Money Awards 2022 颁发
-

荣获2022年埃及金融博览会颁赠
-

2015最佳外汇交易平台
-

2015最佳金融交易平台
-

2013最佳创新外汇平台奖
-

2020年 Cyprus HR Awards 颁赠
-

金融行业的佼佼者
-

认证最优金牌级别
-

2014年首届亚军
-
Finance Magnates 颁发
-
Finance Magnates 颁发
-
Capital Finance International Magazine (CFI.co) 2024年颁赠
-
COLWMA 2024年颁赠
-
荣获World Finance Forex Awards 2023最佳外汇客户服务奖
-
荣获World Finance Forex Awards 2023欧洲最佳外汇经纪商奖
-
荣获World Finance Forex Awards 2023澳大拉西亚最佳外汇经纪商奖
-
荣获World Finance Forex Awards 2023拉丁美洲最佳外汇经纪商奖
-
荣获World Finance Forex Awards 2023中东最佳外汇经纪商奖
-
CFI.co于2023年颁赠
-
荣获2023年City of London Wealth Management Awards
-
荣获2022年埃及金融博览会颁赠
-
荣获2022年City of London Wealth Management Awards
-
CFI.co于2022年颁赠
-
荣获Global Forex Awards 2022 — 零售外汇 颁赠
-
2021年迪拜外汇博览会获颁赠
-
Ultimate Fintech 2021年颁赠
-
荣获2021年City of London Wealth Management Awards
-
FX168于2020年12月颁赠
-
荣获Global Business Awards 2020
-
荣获2020年City of London Wealth Management Awards
-
Capital Finance International Magazine (CFI.co)颁赠
-
Capital Finance International Magazine (CFI.co)颁赠
-
荣获2019年City of London Wealth Management Awards
-
Shares Magazine 授予 UK Forex Awards 2018
-
Capital Finance International Magazine (CFI.co)颁赠
-
Capital Finance International Magazine (CFI.co)颁赠
-
2017年伦敦财富管理奖
-
2016最佳本土 客户服务
-
中东和北非地区(MENA)增长最快的经纪商
-
2015年最佳外汇科技提供商
-
2014年最佳外汇科技提供商
-
2014年最佳外汇科技提供商
-
荣获 The Trading Show 2024年非洲 Africa Fintech 峰会颁赠
-
荣获2024年中东地区 Brokersview 颁赠
-
荣获2024年中东地区 Brokersview 颁赠
-
荣获2024年阿曼 Smart Vision 峰会颁赠
-
荣获2024年迪拜外汇博览会颁赠
-
荣获2024年迪拜 Forex Traders Summit 颁赠
-
2024年埃及 Smart Vision 峰会颁赠
-
投查查于2024年颁赠
-
Capital Finance International Magazine (CFI.co) 2024年颁赠
-
CFI.co于2023年颁赠
-
CFI.co于2023年颁赠
-
交易社区平台FOLLOWME于2022年颁赠
-
2022年迪拜Forex Expo获颁赠
-
2022年迪拜Forex Expo获颁赠
-
荣获Global Forex Awards 2022 — 零售外汇 颁赠
-
CFI.co于2022年颁赠
-
CFI.co于2022年颁赠
-
World Finance Forex Awards 2022 颁发
-
World Finance Forex Awards 2022 颁发
-
World Finance Forex Awards 2022 颁发
-
World Finance Forex Awards 2022 颁发
-
交易社区平台FOLLOWME于2021年颁赠
-
2021年埃及Smart Vision Investment Expo博览会获颁赠
-
CFI.co于2021年颁赠
-
CFI.co于2021年颁赠
-
荣获Global Forex Awards 2021 — 零售外汇 颁赠
-
荣获Global Forex Awards 2021 — 零售外汇 颁赠
-
World Finance 2021颁发
-
World Finance 2021颁发
-
FOLLOWME于2021年颁赠
-
Global Forex Awards 2021 — B2B 颁赠
-
Global Forex Awards颁赠
-
Global Forex Awards颁赠
-
CFI.co于2020年颁赠
-
CFI.co于2020年颁赠
-
荣获Global Business Awards 2020
-
World Finance Magazine 颁赠
World Finance Forex Awards 2020 -
World Finance Magazine 颁赠
World Finance Forex Awards 2020 -
FOLLOWME交易社区授予
-
Global Forex Awards颁赠
-
Global Forex Awards颁赠
-
FinTech Age Awards颁发
-
World Finance Magazine 颁赠
World Finance Forex Awards 2019 -
World Finance Magazine 颁赠
World Finance Forex Awards 2019 -
荣获 World Finance Forex Awards 2018 颁赠
-
荣获2018年埃及金融博览会颁赠
-
荣获 Shares Magazine 的 UK Forex Awards 2017 颁赠
-
荣获 World Finance Forex Awards 2017
-
2016年最佳黄金经纪商
-
2016年最佳外汇经纪商
-
2015年最佳本地客户服务
-
Global Brands Magazine 颁赠
-
Online Money Awards 2022 颁发
-
荣获2022年埃及金融博览会颁赠
-
2015最佳外汇交易平台
-
2015最佳金融交易平台
-
2013最佳创新外汇平台奖
-
2020年 Cyprus HR Awards 颁赠
-
金融行业的佼佼者
-
认证最优金牌级别
-
2014年首届亚军

Awarded BestBrokerYear After Year
CATEGORIES
News
- 【XM Forex】--USD/INR Analysis: New Highs and a New Normal as Global Forex Reacts
- 【XM Market Review】--USD/CAD Forecast: USD Resilient Against CAD
- 【XM Market Review】--EUR/USD Weekly Forecast: Long-Term Lows Challenged as Fragil
- 【XM Decision Analysis】--USD/CAD Forecast: Continues to Eye Massive Barrier
- 【XM Market Analysis】--NASDAQ 100 Forecast: Index Runs into Ceiling on Thursday
market analysis
The weekly line is under pressure, and gold and silver will be much lower this week
Wonderful introduction:
Without the depth of the blue sky, there can be the elegance of white clouds; without the magnificence of the sea, there can be the elegance of the stream; without the fragrance of the wilderness, there can be the emerald green of the grass. There is no seat for bystanders in life, we can always find our own position, our own light source, and our own voice.
Hello everyone, today XM Foreign Exchange will bring you "[XM Group]: The weekly line is under pressure, and gold and silver will delay low this week." Hope it will be helpful to you! The original content is as follows:
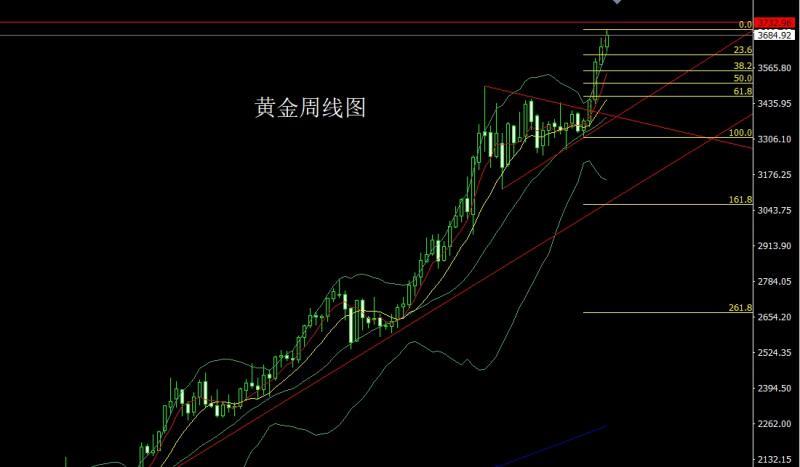
Last week, the gold market opened at the 3642.9 position at the beginning of the week, and the market fell first, which gave the weekly low point of 3626.2, and then the market rose strongly. The weekly high and fell, and the market rose twice, and the market finally closed at the 3684.9 position. After the market closed with a large positive line with an upper and lower shadow line. After this pattern ended, There is a demand for bullishness this week. At the point, the longs of 3325 and 3322 below are the longs of 3368-3370 last week and the longs of 3377 and 3385 longs and 3563 last week, and the stop loss followed at 3570. It fell back to 3672 longs and 3666 in the morning today. The target is 3692 and 3700, and the historical pressure www.xmtraders.competition of 3707. If the position is broken, look at 3712 and 3721 and 3732 pressure points.
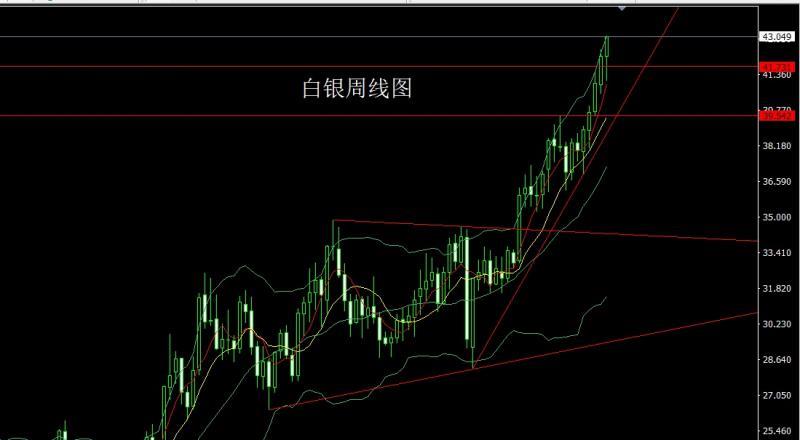
The silver market opened at 42.17 last week and then the market first rose. The market first fell. The weekly line was at 41.1 at the lowest point and the market rose strongly. The weekly line reached the highest point and then the market consolidated. The weekly line finally closed at 43.049 and then the market closed with a hammer head with an extremely long lower shadow line. After this pattern ended, it fell back to the low-long position today, with a point at 37.8 at the bottom.The stop loss followed by the 39.5 position reduction last Friday, and the 42.6 long stop loss is 42.4 today, and the target is 43.1 and 43.3 and 43.5.
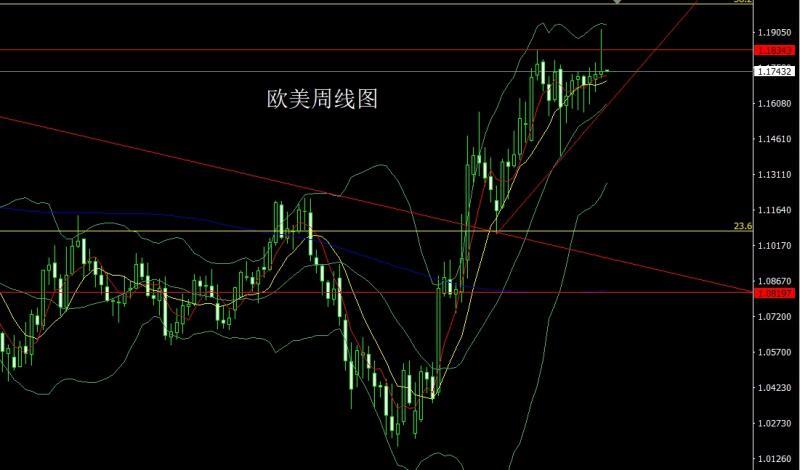
The European and American markets opened at 1.17315 last week and the market fell first, giving the weekly low of 1.17135. The market rose strongly. The weekly line reached the highest position of 1.5 and then the market fell at the end of the trading session. The weekly line finally closed at 1.17429 and then closed with a shooting star with a very long upper shadow line. After this pattern ended, the long 1.16600 and the long 1.17100 below left the market, and today the short stop loss of 1.17800 today is 1.18000. The target below is 1.17300 and 1.17100 and 1.16900.
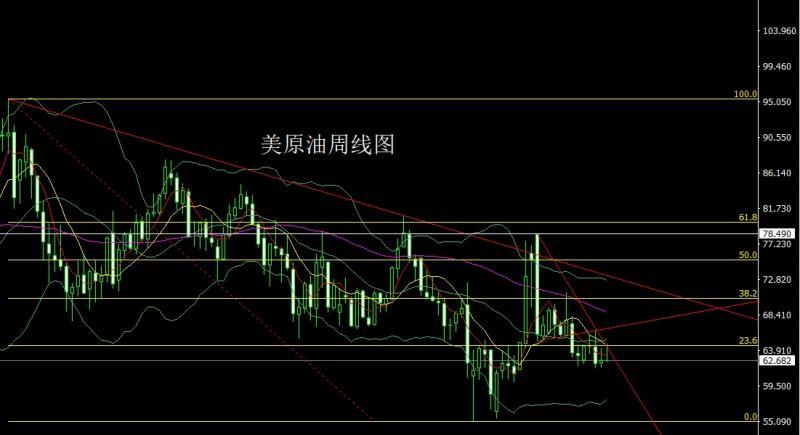
The U.S. crude oil market opened at 62.67 last week and the market fell slightly, and then the market rose strongly. The weekly line reached the highest point of 64.79 and then the market fell strongly. The weekly line finally closed at 62.55, and the weekly line finally closed at 62.69. After the weekly line closed with a shooting star with a very long upper shadow line. After this pattern ended, the short position of 64.4 last week was reduced and the stop loss followed at 64.2. Today, the target below 63.3 short stop loss is 62.5 and 62-61.5-61.3.
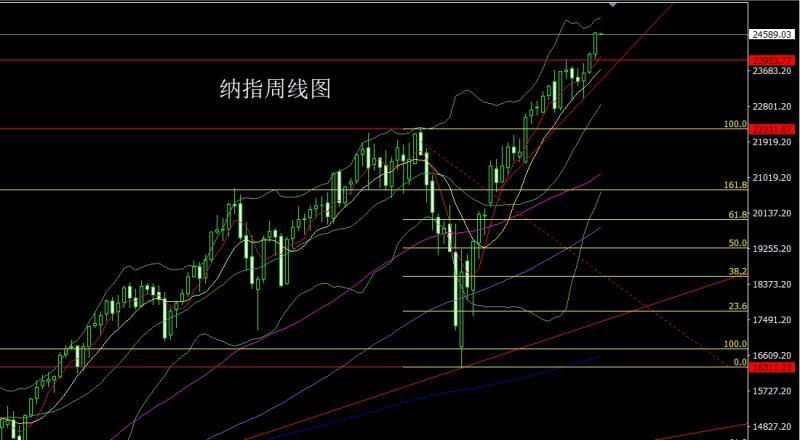
The Nasdaq market opened at 24094.7 last week and then the market rose first and gave the position of 24391.9, and then the market fell strongly. The weekly line was at the lowest point of 23984.53 and then the market rose strongly. The weekly line reached the highest point of 24642.98 and then the market consolidated. The weekly line finally closed at 24612.64, and then the market was a large positive line with a longer lower shadow line. After closing, this pattern ended, the stop loss of more than 24480 today was 24420, with a target of 24650 and 24750 and 24800.
The fundamentals, last week's fundamentals market focused on the Federal Reserve's interest rate decision. The Federal Reserve announced a 25 basis point interest rate cut last week, and the interest rate fell to the range of 4.00%-4.25%. This move marks the restart of the pace of interest rate cuts that have been suspended since December last year. Despite this, there are still differences within FOMC regarding the extent of interest rate cuts, and the newly appointed director Milan advocates that a 50 basis point cut should be cut. Regarding future interest rate paths, the median Fed dot chart shows that it is expected to cut interest rates twice this year, one more than expected in June. Specifically, 9 of the 19 officials are expected to cut interest rates twice this year.Two people are expected to cut interest rates again, six people are expected to cut interest rates again, one person believes that interest rates should be kept unchanged throughout the year, and one person believes that interest rates need to be cut by another 125 basis points this year. The forecast for interest rate cuts in 2026 remains once. Powell stressed that this interest rate cut is a risk management rate cut, and the downward risks of the labor market are the focus of this decision, but there is no need to quickly adjust interest rates. Decisions will be made based on the latest data in the future. Powell also pointed out that the current slowdown in US economic growth mainly reflects the slowdown in consumer spending. In terms of inflation, the transfer of tariffs to consumers has already occurred, but it is smaller than expected. In terms of employment, the annual employment data revisions are almost exactly in line with expectations, but the revised employment data means that the labor market is no longer stable. In terms of political influence, Powell was firmly www.xmtraders.committed to the independence of the Federal Reserve, responding to Milan's impact on interest rate resolutions that the only way a single voter could have an impact is to make a very persuasive argument. He also said that there was no consideration for inclusion in the "third mission" in other ways. So after the boots landed, the US dollar index rose, and gold and silver fell for a while. Over the weekend, Australia, Canada, the United Kingdom and Portugal announced their recognition of the Palestinian state. This is also because Israel in the Middle East is too anti-human, which makes these American younger brothers and their boss part ways in this matter. The fundamentals of this week are mainly focused on the FOMC permanent vote www.xmtraders.committee at 21:45 today and New York Fed Chairman Williams made a speech on monetary policy and economic outlook. Then look at the initial value of the euro zone September consumer confidence index at 22:00. On Tuesday, we focused on the US second quarter current account at 20:30. Then look at the initial S&P Global Manufacturing PMI in September at 21:45 and the initial S&P Global Services PMI in September at the United States. Look at the US September Richmond Fed Manufacturing Index at 22:00 later. Wednesday, we will pay attention to the annualized total number of new home sales in the United States in August at 22:00. Look at the 22:30 U.S. to September 19 weekly EIA crude oil inventories and U.S. to September 19 weekly EIA Cushing crude oil inventories and U.S. to September 19 weekly EIA strategic oil reserve inventories. On Thursday, we focused on the number of initial unemployment claims in the United States to September 20, from 20:30, and the final value of the annualized quarterly rate of the US real GDP in the second quarter, and the final value of the core PCE price index in the second quarter, as well as the monthly rate of the US durable goods orders in August. Then look at the annualized total number of existing home sales in the United States at 22:00. Friday is the key to this week, focusing mainly on the annual rate of the US core PCE price index in August at 20:30, with an expected 2.9% in this round. Look at the final value of the University of Michigan Consumer Confidence Index in September at 22:00 and the expected final value of the first-year inflation rate in September.
In terms of operation, gold: 3325 and 3322 long and 3322 below and 3370 long and 3377 and 3385 long and 3563 long and 3563 long and 3570, and then the stop loss was followed at 3570. Today's morning session fell back to 3672 long and 3666. The target was 3692 and 3700, and the break was 3707 history.In the fight for pressure, if the position breaks, look at the pressure points of 3712 and 3721 and 3732.
Silver: The long at 37.8 below and the long at 38.8 last Friday, the stop loss followed at 39.5, 42.6 today, the stop loss is 42.4, the target is 43.1 and 43.3 and 43.5.
Europe and the United States: The long at 1.16600 below and the long at 1.17100 below, the short stop loss is 1.18000 today, the target is 1.17300 and 1.171 below 00 and 1.16900.
U.S. crude oil: After short reduction in position at 64.4 last week, the stop loss followed at 64.2. Today, the short stop loss at 63.3 is 63.8. The target is 62.5 and 62-61.5-61.3.
Nasdaq: Today, the stop loss is 24480 more than 24420, the target is 24650 and 24750 and 24800.
The above content is about "【XM Group]: The weekly line is strong and the sun is facing pressure, and gold and silver are delaying low this week” is carefully www.xmtraders.compiled and edited by the editor of XM Forex. I hope it will be helpful to your trading! Thanks for the support!
Due to the author's limited ability and time constraints, some content in the article still needs to be discussed and studied in depth. Therefore, in the future, the author will conduct extended research and discussion on the following issues:
Disclaimers: XM Group only provides execution services and access permissions for online trading platforms, and allows individuals to view and/or use the website or the content provided on the website, but has no intention of making any changes or extensions, nor will it change or extend its services and access permissions. All access and usage permissions will be subject to the following terms and conditions: (i) Terms and conditions; (ii) Risk warning; And (iii) a complete disclaimer. Please note that all information provided on the website is for general informational purposes only. In addition, the content of all XM online trading platforms does not constitute, and cannot be used for any unauthorized financial market trading invitations and/or invitations. Financial market transactions pose significant risks to your investment capital.
All materials published on online trading platforms are only intended for educational/informational purposes and do not include or should be considered for financial, investment tax, or trading related consulting and advice, or transaction price records, or any financial product or non invitation related trading offers or invitations.
All content provided by XM and third-party suppliers on this website, including opinions, news, research, analysis, prices, other information, and third-party website links, remains unchanged and is provided as general market commentary rather than investment advice. All materials published on online trading platforms are only for educational/informational purposes and do not include or should be considered as applicable to financial, investment tax, or trading related advice and recommendations, or transaction price records, or any financial product or non invitation related financial offers or invitations. Please ensure that you have read and fully understood the information on XM's non independent investment research tips and risk warnings. For more details, please click here